Gold Price Forecast: XAU/USD declines towards $1960 as USD rebounds ahead of Core PCE Price Index
- Gold price is declining towards $1960.00 as investors are getting anxious ahead of US PCE inflation data.
- The reputation of Gold as a safe-haven amid US banking jitters has ebbed.
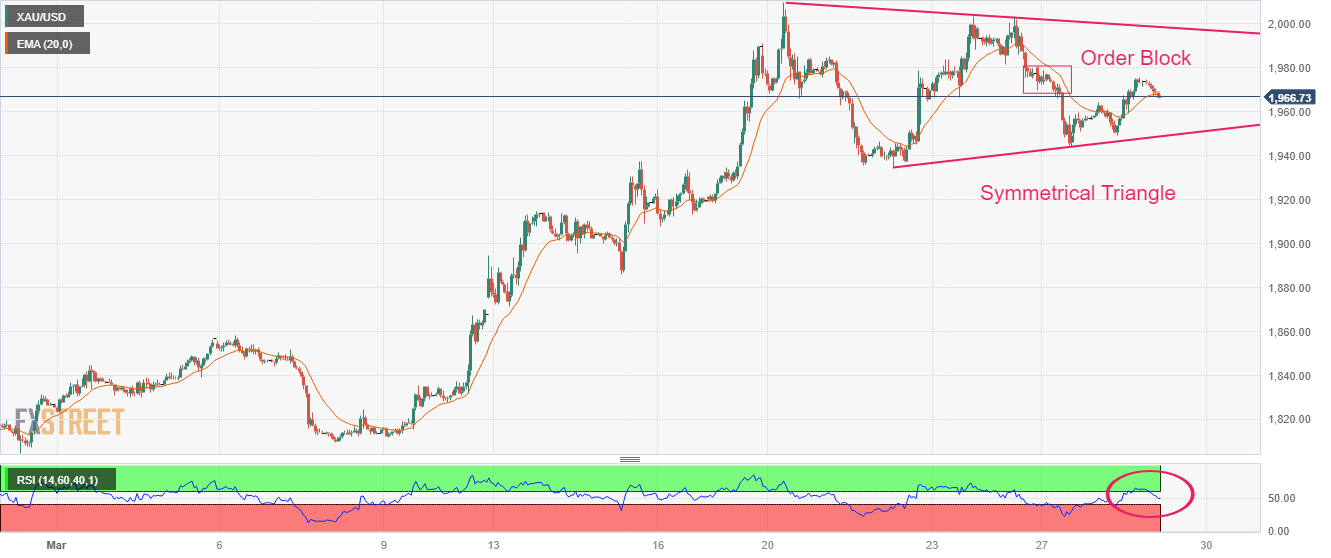
- On a broader note, Gold price is auctioning in a Symmetrical Triangle chart pattern.
Gold price (XAU/USD) has dropped after failing to sustain above $1,970.00 in the Asian session. The precious metal has lost its appeal as fears of the United States banking crisis have receded significantly. The Gold price is expected to extend its correction further as the US Dollar Index (DXY) has shown a recovery move.
The USD Index has rebounded after building an intermediate cushion around 102.40. The USD Index has extended its recovery to near 102.60 as investors are shifting their focus to core Personal Consumption Expenditure (PCE) Price Index data, which is scheduled for Friday.
Federal Reserve’s (Fed) preferred inflation gauge is expected to accelerate by 0.4%, lower than the former expansion of 0.6%. The annual figure is expected to remain steady at 4.7%. A deceleration in the pace of consumer spending on core goods will further ease the chances of one more rate hike by the Fed. Chances are favoring a decline in consumer spending as labor cost index remained lower than anticipated. Also, US banks have tightened credit conditions for households and businesses after the collapse of three mid-size banks.
Meanwhile, S&P500 futures have generated firmer gains in the Asian session after a rangebound auction on Tuesday. US equities have been underpinned on hopes that the Federal Reserve (Fed) will keep rates steady ahead.
Gold technical analysis
Gold price has dropped after a pullback move to near the prior order block region placed in a range of $1,968-1,980 on an hourly scale. On a broader note, the precious metal is auctioning in a Symmetrical Triangle chart pattern. The Gold price is struggling in holding its auction above the 20-period Exponential Moving Average (EMA) at $1,968.00.
Meanwhile, the Relative Strength Index (RSI) (14) has failed in sustaining inside the bullish range of 60.00-80.00.
Gold hourly chart