USD/MXN drifting lower towards 200-DMA; Banxico's auction 'fixes' peso not Mexico
Currently, USD/MXN is trading at 19.91, down -0.42% or (829)-pips on the day, having posted a daily high at 20.09 and low at 19.91.
The American dollar vs. Mexican peso clocked, as of writing, another trading session in red due to Banxicos 'fix' via a $20 billion auction in FX hedges. The peso appreciation accelerated as prices broke the 100-DMA. Hence, the central bank decided to intervene the exotic avoiding additional rate hikes, but such solution has little to no impact in the country's economy.
On the data front, the US docket had limited ammo to counter-attack Banxico's short-term strategy to aid a weak and vulnerable Mexican peso. However, FOMC minutes due in the next 2-hours could provide traders evidence to add dollar-long positions if there is any wording related to a rate hike in March.
Banxico Implements Fancy Pants Intervention!
Historical data available for traders and investors indicates during the last 8-weeks that USD/MXN, a commodity-linked and exotic currency, had the best trading day at +1.83% (Jan.10) or 3983-pips, and the worst at -2.22% (Jan.25) or (4684)-pips. Furthermore, the US 10yr treasury yields have traded from 2.45% to 2.38%, down -1.10% on the day at 2.40% or -0.0268.
Technical levels to watch
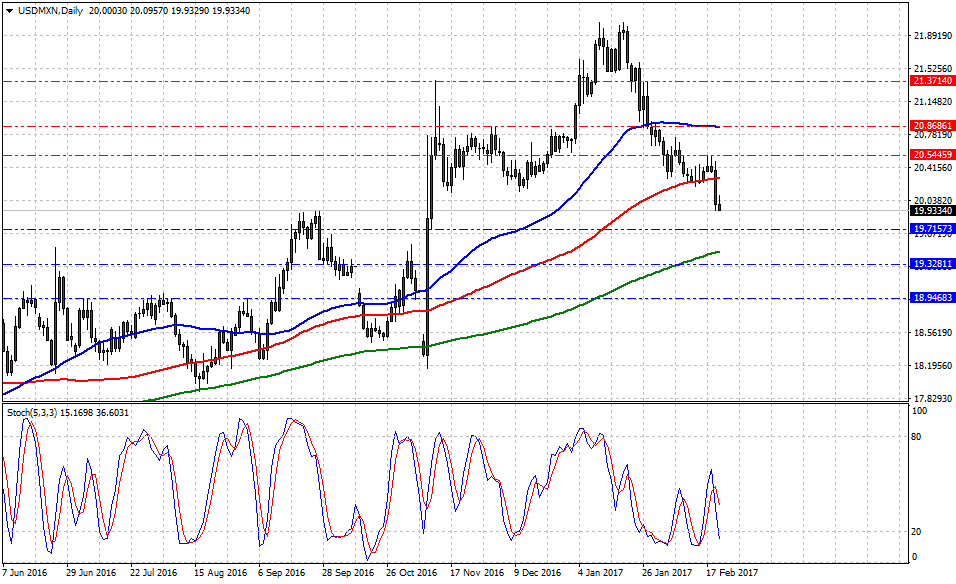
In terms of technical levels, upside barriers are aligned at 20.28 (100-DMA), then at 20.53 (high Feb.20) and above that at 20.86 (50-DMA). While supports are aligned at 20.24 (low Feb.10), later at 19.72 (low Nov.10) and below that at 19.11 (low Nov.3). On the other hand, Stochastic Oscillator (5,3,3) seems to accelerate the pace into the oversold territory, but 'extreme attention' over US Treasuries to avoid a market trap. Therefore, there is evidence to expect more Mexican Peso gains in the near term.
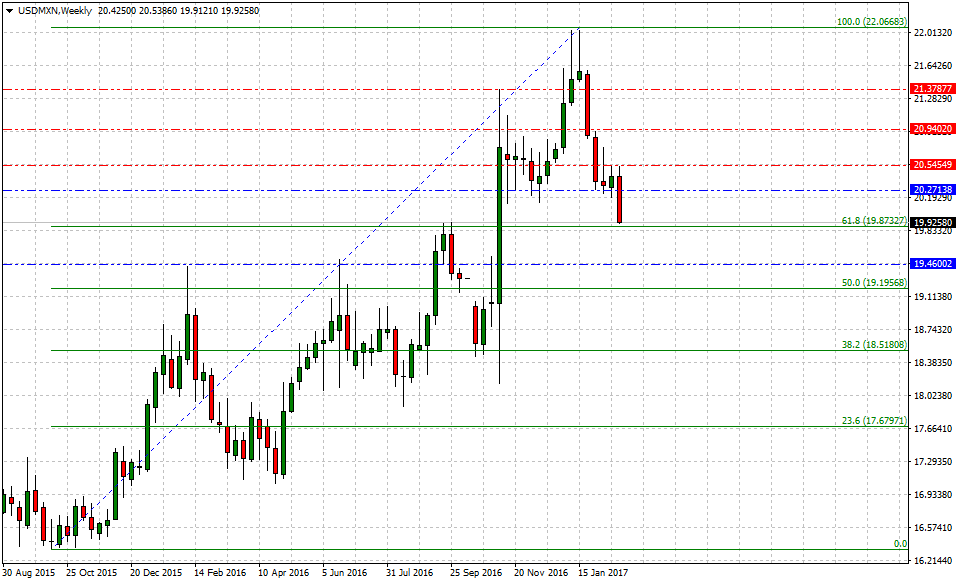
On the medium-term view, if 22.03 (high Jan.15) is in fact, the top during the first semester in 2017, then traders and investors would have allocated risk around the following support levels: 19.87 (short-term 61.8% Fib), then at 19.46 (low Sep.18) and finally below that at 19.19 (short-term 50.0% Fib). On the other hand, upside barriers are aligned at 20.53 (high Feb.2), later at 20.92 (high Jan.29) and above that at 21.38 (high Nov.6).
Equity players continue to expect tax reform