Back
10 Aug 2018
DXY Technical Analysis: Hourly support emerged just above 95.50
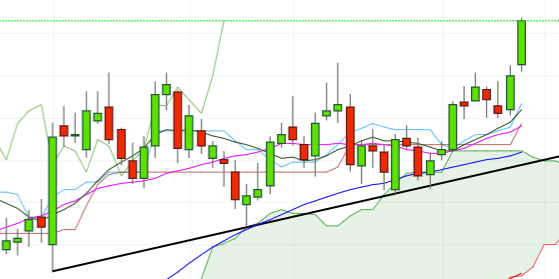
- YTD peaks in levels beyond 96.00 the figure, where it is now looking to consolidate.
- The constructive stance stays unchanged around the buck while above the short-term support line, today just below 94.50. In the daily chart, interim contention emerges in the 94.91/95.11 band, where aligns the 21-day SMA, recent lows, the 10-day SMA and the 200-hour SMA.
- In the hourly chart, quite decent support emerges in the 95.55 region for the time being.
- In terms of significant resistance levels, there is nothing until 97.87, the 61.8% Fibo of the 2017-2018 drop and June’s 2017 peak.
DXY daily chart

Daily high: 96.18
Daily low: 95.53
Support Levels
S1: 95.23
S2: 94.83
S3: 94.64
Resistance Levels
R1: 95.82
R2: 96.01
R3: 96.41
