Back
21 Jan 2019
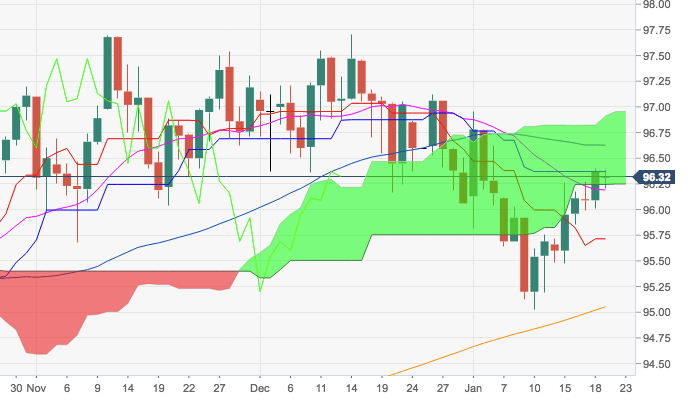
US Dollar Index Technical Analysis: Upside remains firm. Door open for a visit to 97.00
- DXY is extending the strong rebound from yearly lows in the 95.00 neighbourhood, managing to retake 96.00 the figure and pierce the base of the daily cloud.
- The continuation of the bull run appears likely in the near term, with the immediate target now at the 97.00 handle, or YTD peaks.
- The interim hurdle aligns at the 55-day SMA, today at 96.60, ahead of the 23.6% Fibo retracement of the September-December up move.
DXY daily chart
Dollar Index Spot
Overview:
Today Last Price: 96.33
Today Daily change: -0.04 pips
Today Daily change %: -0.04%
Today Daily Open: 96.37
Trends:
Daily SMA20: 96.18
Daily SMA50: 96.65
Daily SMA100: 96.07
Daily SMA200: 95.02
Levels:
Previous Daily High: 96.4
Previous Daily Low: 96.01
Previous Weekly High: 96.4
Previous Weekly Low: 95.47
Previous Monthly High: 97.71
Previous Monthly Low: 96.06
Daily Fibonacci 38.2%: 96.25
Daily Fibonacci 61.8%: 96.16
Daily Pivot Point S1: 96.12
Daily Pivot Point S2: 95.87
Daily Pivot Point S3: 95.73
Daily Pivot Point R1: 96.51
Daily Pivot Point R2: 96.65
Daily Pivot Point R3: 96.9