EUR/GBP Technical Analysis: Euro is trading up near key resistance at 0.8780 level
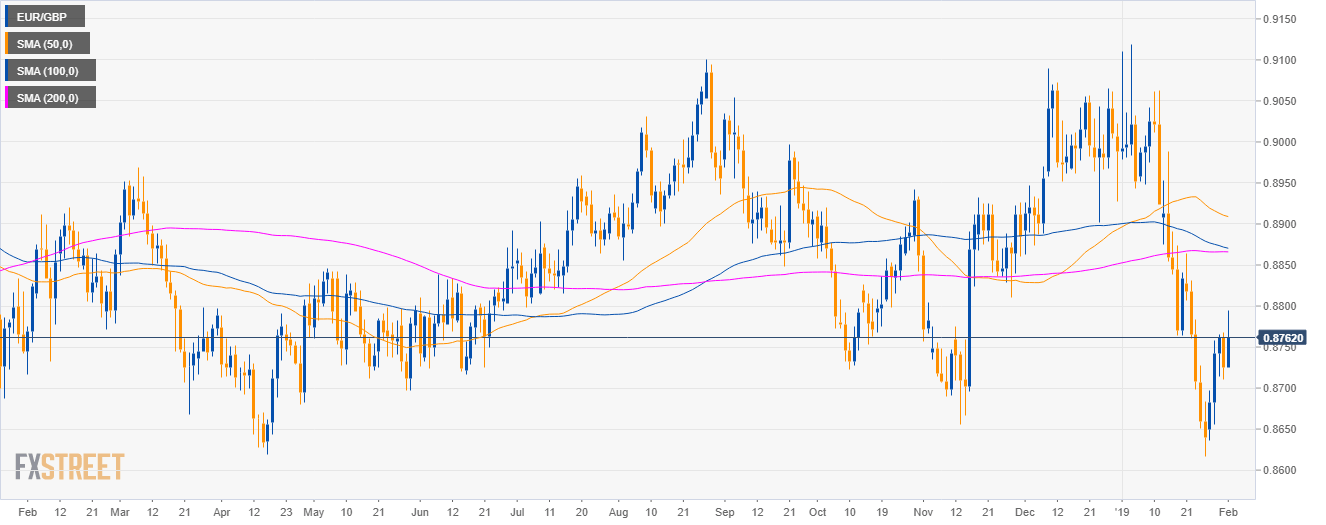
EUR/GBP daily chart
- EUR/GBP is trading in a sideways trend below the 50, 100 and 200-day simple moving averages (SMAs).

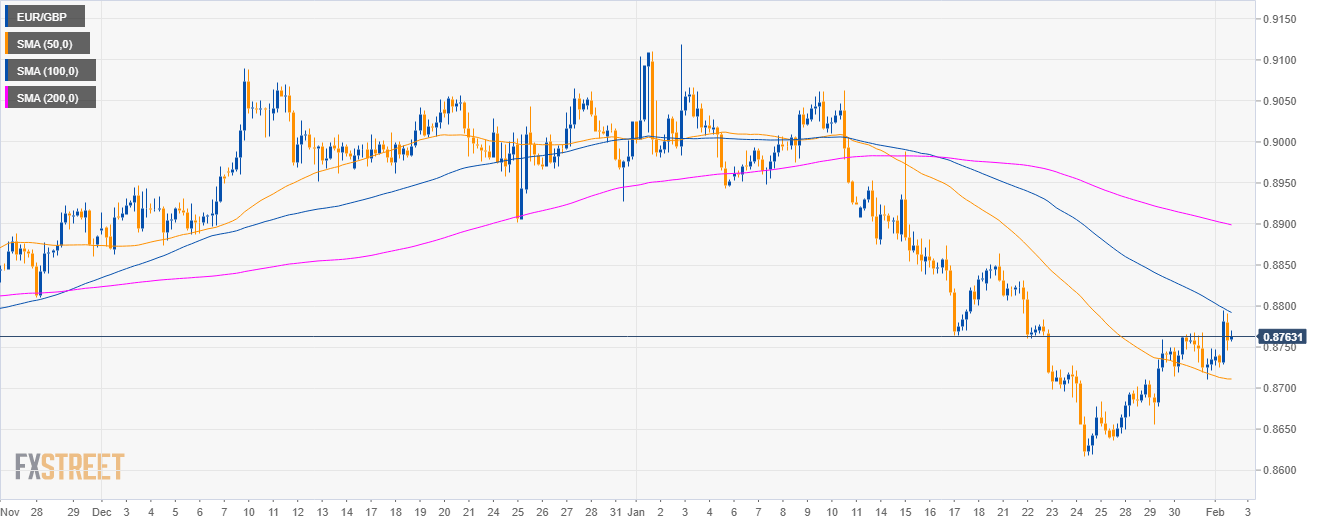
EUR/GBP 4-hour chart
- EUR/GBP is trading below the 100 and 200 SMA on the 4-hour chart.

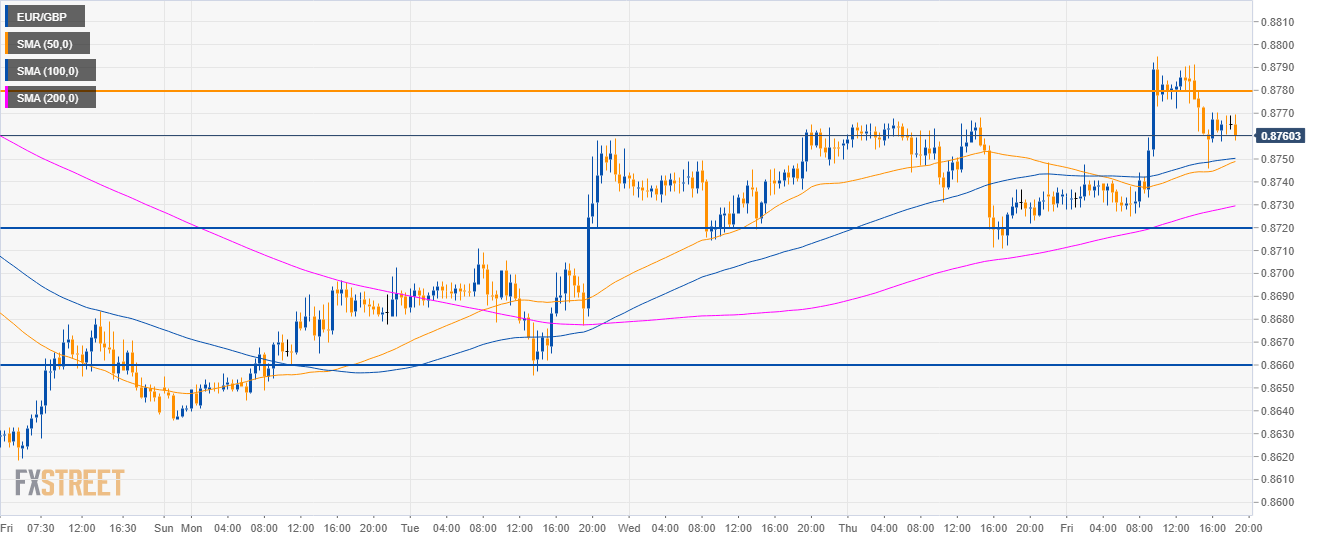
EUR/GBP 30-minute chart
- EUR/GBP is having bullish momentum on lower-time frames.
- If Euro bulls are able to break above 0.8780 key resistance, they can expect a run to 0.8840 level.
- To the downside, support is at 0.8720 and 0.8660 level.

Additional key levels
EUR/GBP
Overview:
Today Last Price: 0.8761
Today Daily change: 36 pips
Today Daily change %: 0.41%
Today Daily Open: 0.8725
Trends:
Daily SMA20: 0.8831
Daily SMA50: 0.8911
Daily SMA100: 0.8872
Daily SMA200: 0.8866
Levels:
Previous Daily High: 0.8768
Previous Daily Low: 0.8711
Previous Weekly High: 0.8864
Previous Weekly Low: 0.8617
Previous Monthly High: 0.9119
Previous Monthly Low: 0.8617
Daily Fibonacci 38.2%: 0.8733
Daily Fibonacci 61.8%: 0.8746
Daily Pivot Point S1: 0.8701
Daily Pivot Point S2: 0.8678
Daily Pivot Point S3: 0.8644
Daily Pivot Point R1: 0.8758
Daily Pivot Point R2: 0.8792
Daily Pivot Point R3: 0.8815
