Back
2 Feb 2019
US Dollar Index Technical Analysis: Greenback bulls looking at the 96.00 figure
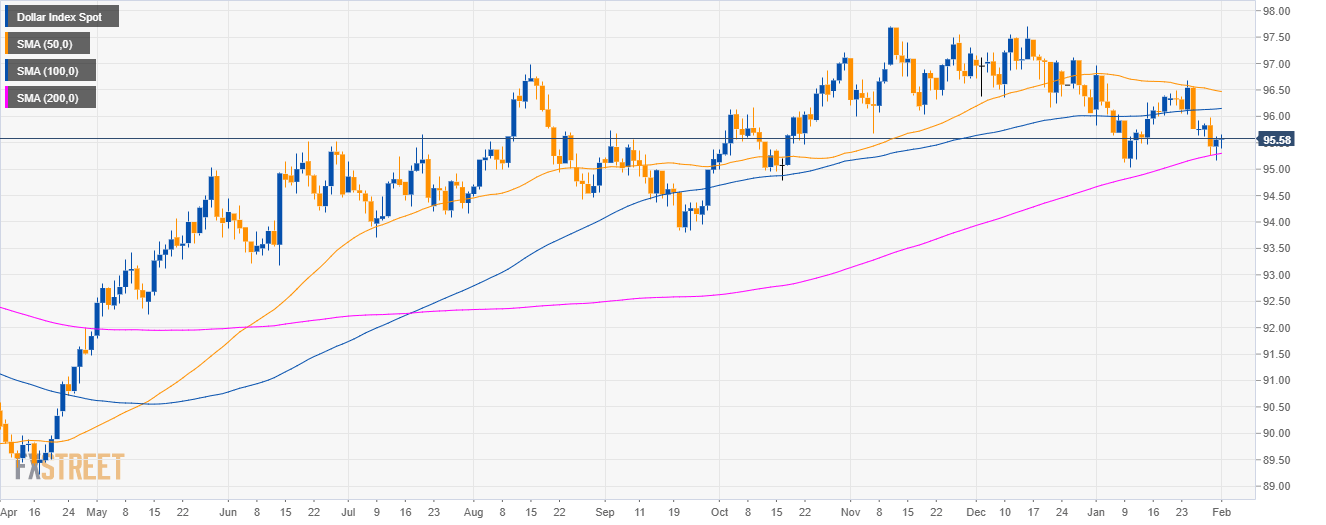
DXY daily chart
- The US Dollar Index (DXY) is in a bull trend above 200-day simple moving average (SMA).
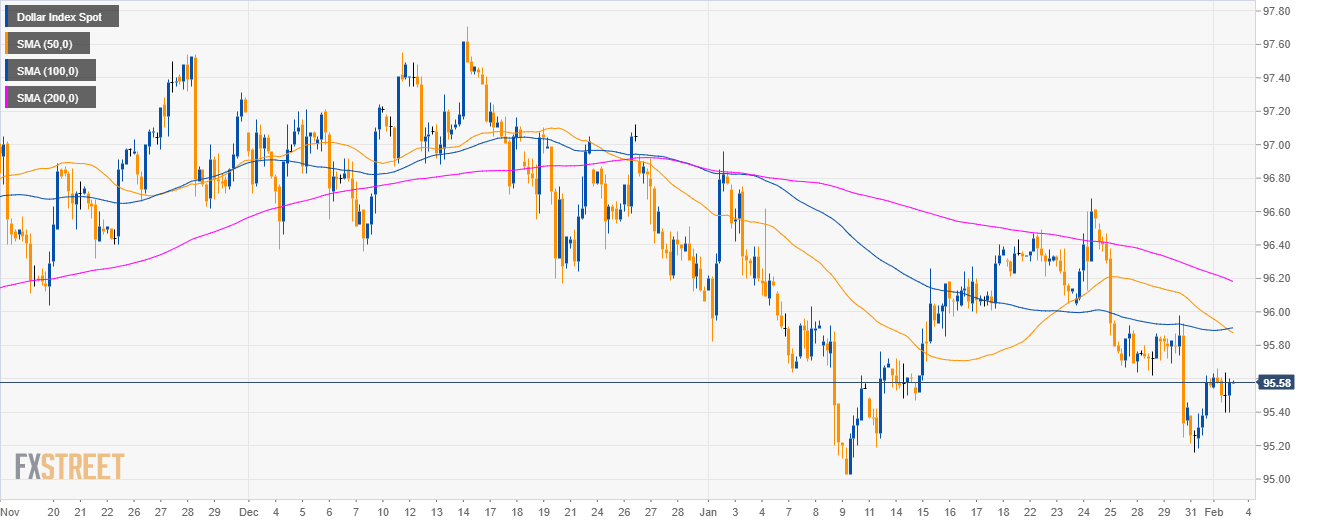
DXY 4-hour chart
- DXY is trading below its main SMAs suggesting bearish momentum in the medium-term.
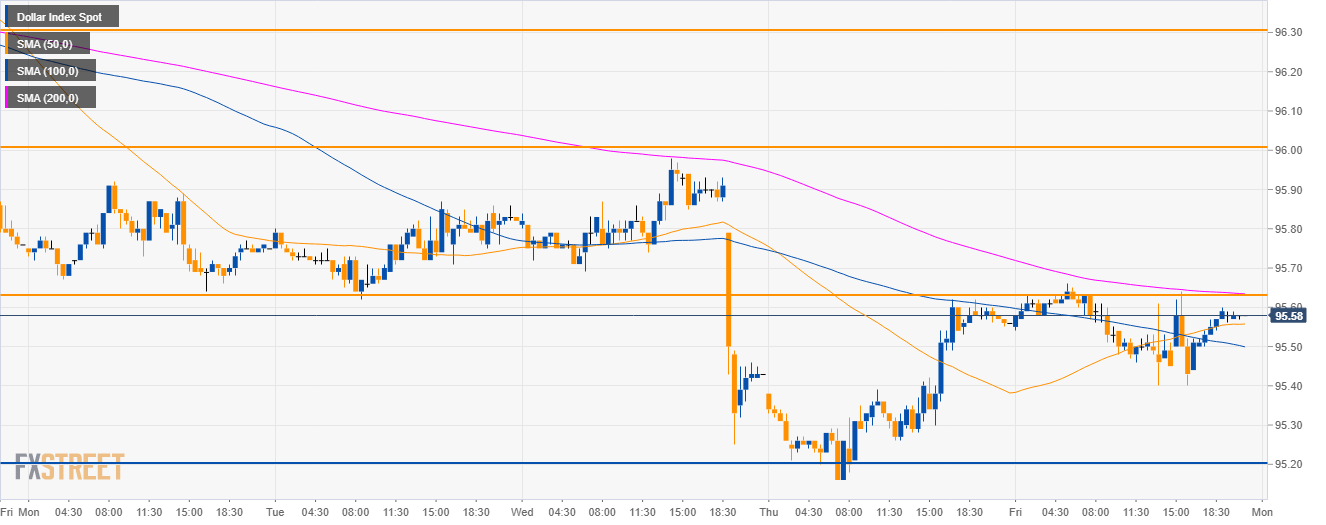
DXY 30-minute chart
- DXY is trading just below the 95.60 resistance.
- Bears will want to continue the move down to 95.20 while bulls will try to reach the 96.00 figure next week.
Additional key levels
Dollar Index Spot
Overview:
Today Last Price: 95.58
Today Daily change %: 0.02%
Today Daily Open: 95.56
Trends:
Daily SMA20: 95.9
Daily SMA50: 96.49
Daily SMA100: 96.14
Daily SMA200: 95.28
Levels:
Previous Daily High: 95.62
Previous Daily Low: 95.16
Previous Weekly High: 96.68
Previous Weekly Low: 95.75
Previous Monthly High: 96.96
Previous Monthly Low: 95.03
Daily Fibonacci 38.2%: 95.44
Daily Fibonacci 61.8%: 95.34
Daily Pivot Point S1: 95.27
Daily Pivot Point S2: 94.99
Daily Pivot Point S3: 94.81
Daily Pivot Point R1: 95.73
Daily Pivot Point R2: 95.91
Daily Pivot Point R3: 96.19