EUR/USD Technical Analysis: Worst weekly decline since September 2018
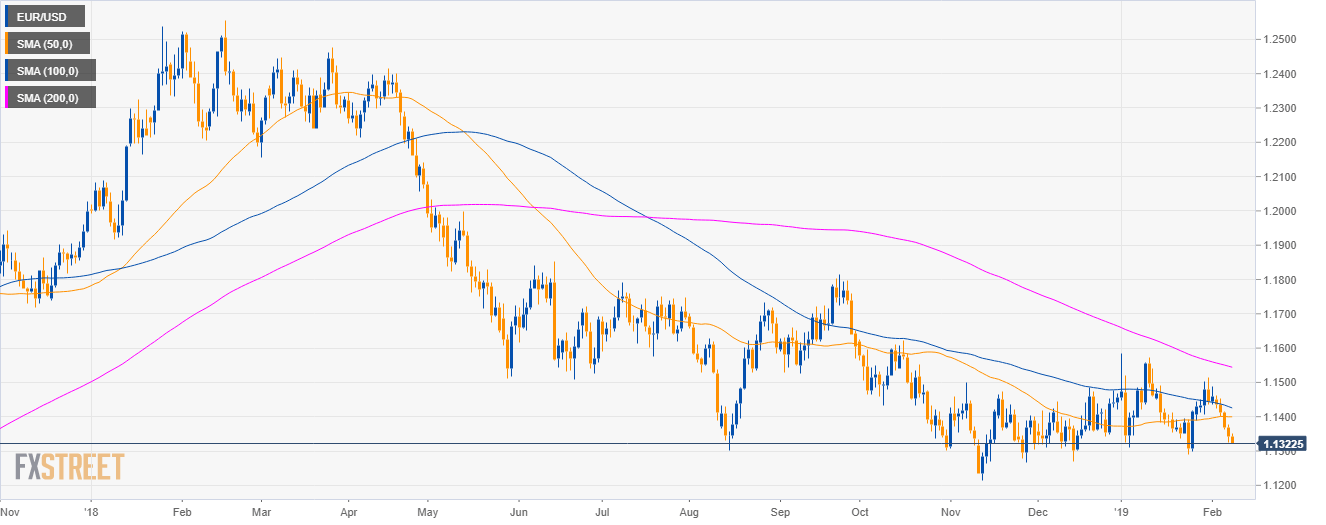
EUR/USD daily chart
- EUR/USD is trading in a bear trend below the 200-day simple moving average (SMA).
- EUR/USD suffered the worst weekly decline since September 2018.
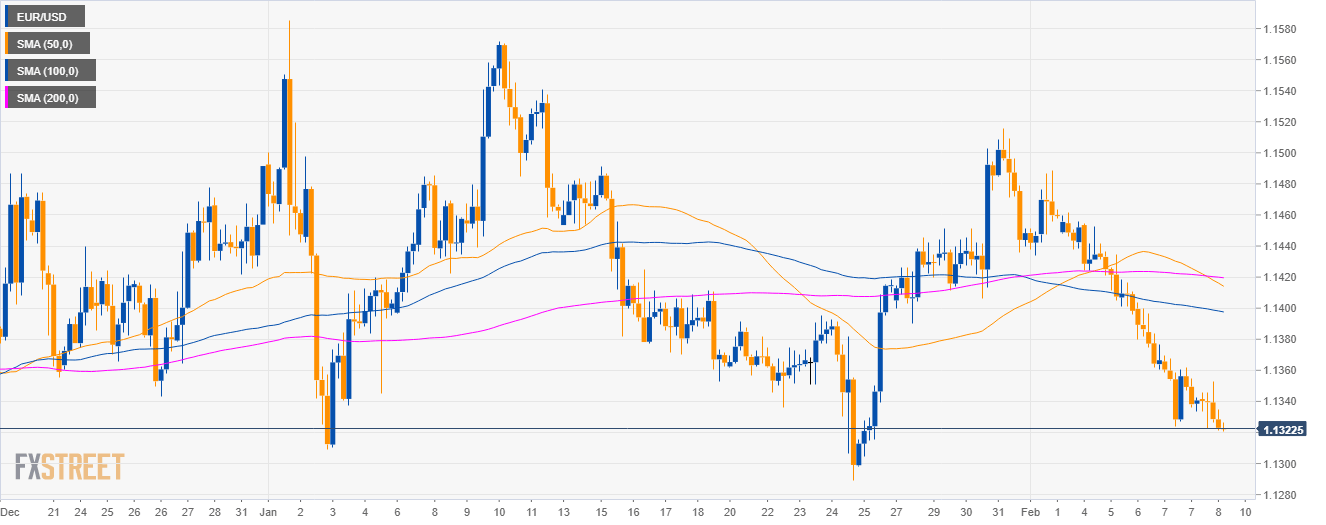
EUR/USD 4-hour chart
- EUR/USD is trading below its main SMAs suggesting bearish momentum in the medium-term.
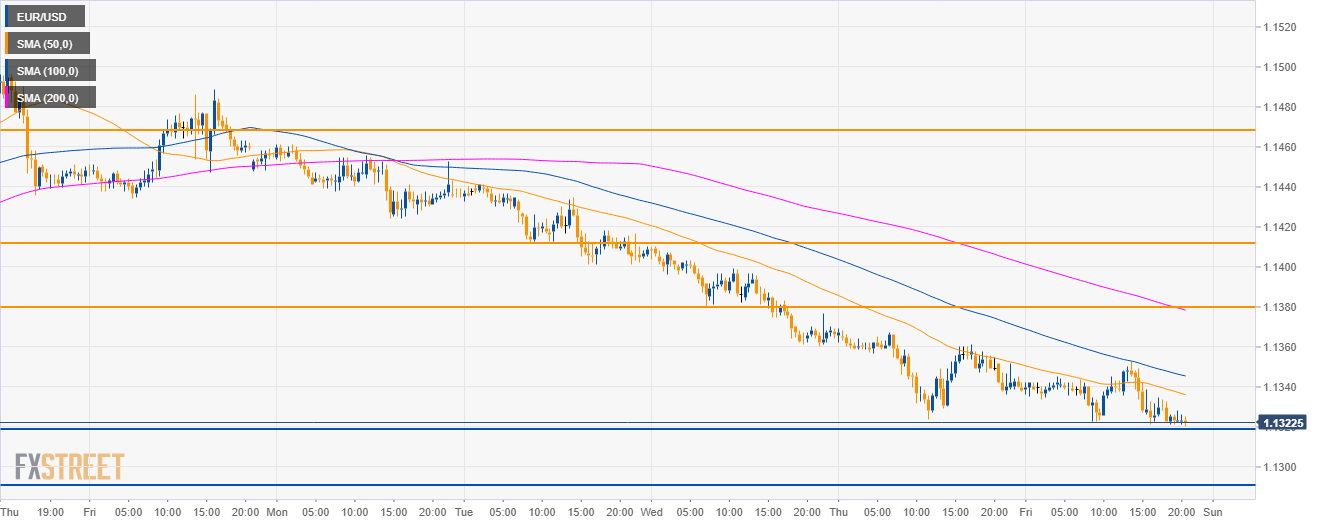
EUR/USD 30-minute chart
- EUR/USD is evolving below the 100 and 200 SMA suggesting bearish momentum.
- A breakdown below 1.1320 can lead to a drop to the 1.1290 level.
- On the flip side, a daily close above 1.1380 and the 200 SMA could be considered bullish for EUR/USD.
Additional key levels
EUR/USD
Overview:
Today Last Price: 1.1322
Today Daily change: -20 pips
Today Daily change %: -0.18%
Today Daily Open: 1.1342
Trends:
Daily SMA20: 1.1406
Daily SMA50: 1.14
Daily SMA100: 1.143
Daily SMA200: 1.1548
Levels:
Previous Daily High: 1.1376
Previous Daily Low: 1.1324
Previous Weekly High: 1.1516
Previous Weekly Low: 1.139
Previous Monthly High: 1.1586
Previous Monthly Low: 1.1289
Daily Fibonacci 38.2%: 1.1344
Daily Fibonacci 61.8%: 1.1356
Daily Pivot Point S1: 1.1319
Daily Pivot Point S2: 1.1295
Daily Pivot Point S3: 1.1266
Daily Pivot Point R1: 1.1371
Daily Pivot Point R2: 1.14
Daily Pivot Point R3: 1.1424