USD/CHF technical analysis: 50-DMA holds the key to monthly trend-line resistance
- USD/CHF again confronts 50-DMA while seeking a downward resistance-line since August 01.
- 23.6% of Fibonacci retracement can offer immediate support.
- Swiss ZEW Survey – Expectations in the spotlight.
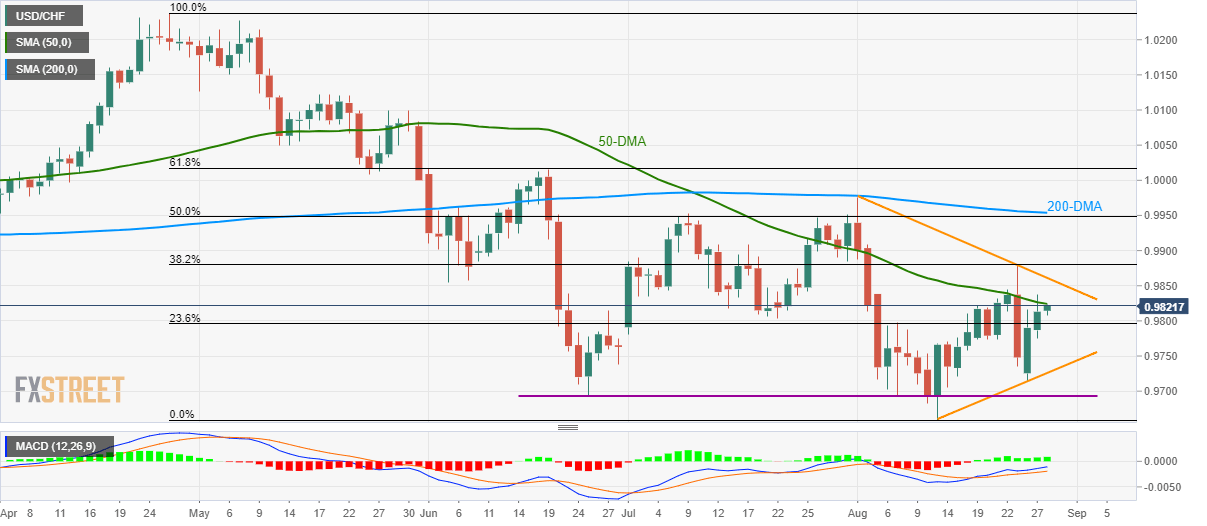
Sustained trading beyond 23.6% Fibonacci retracement of April-August declines enables USD/CHF to near the 50-day simple moving average (DMA) while taking the bids to 0.9820 during Wednesday’s Asian session.
With the 12-bar moving average convergence and divergence (MACD) indicating bullish signal, prices are more likely to cross the 50-DMA barrier of 0.9825. However, a falling trend-line since month-start, at 0.9861 will question buyers afterward.
If buyers manage to clear 0.9861 resistance-line, 38.2% Fibonacci retracement level of 0.9880 can please short-term bulls ahead of challenging them with 0.9949/54 area including 200-DMA and 50% Fibonacci retracement.
Alternatively, 23.6% Fibonacci retracement level of 0.9796 acts as immediate support, a break of which could drag prices to two-week-old rising trend-line, at 0.9726.
Given the sellers’ capacity derail the support-line, 0.9690/95 horizontal-region comprising low of June and August 08 appear in the spotlight.
On a different note, Swiss ZEW Survey – Expectations for August will also direct near-term moves. The sentiment number last dropped to -24.
USD/CHF daily chart
Trend: Pullback expected