Back


29 Aug 2019
EUR/USD technical analysis: Euro remains under pressure after ECB’s Knot-inspired spike
- EUR/USD is under pressure after the release of the US Gross Domestic Product.
- The market had a bullish spike which covered the entire daily range after comments from ECB's Knot.
- The level to beat for sellers is the 1.1052 support followed by the 1.1033 level.
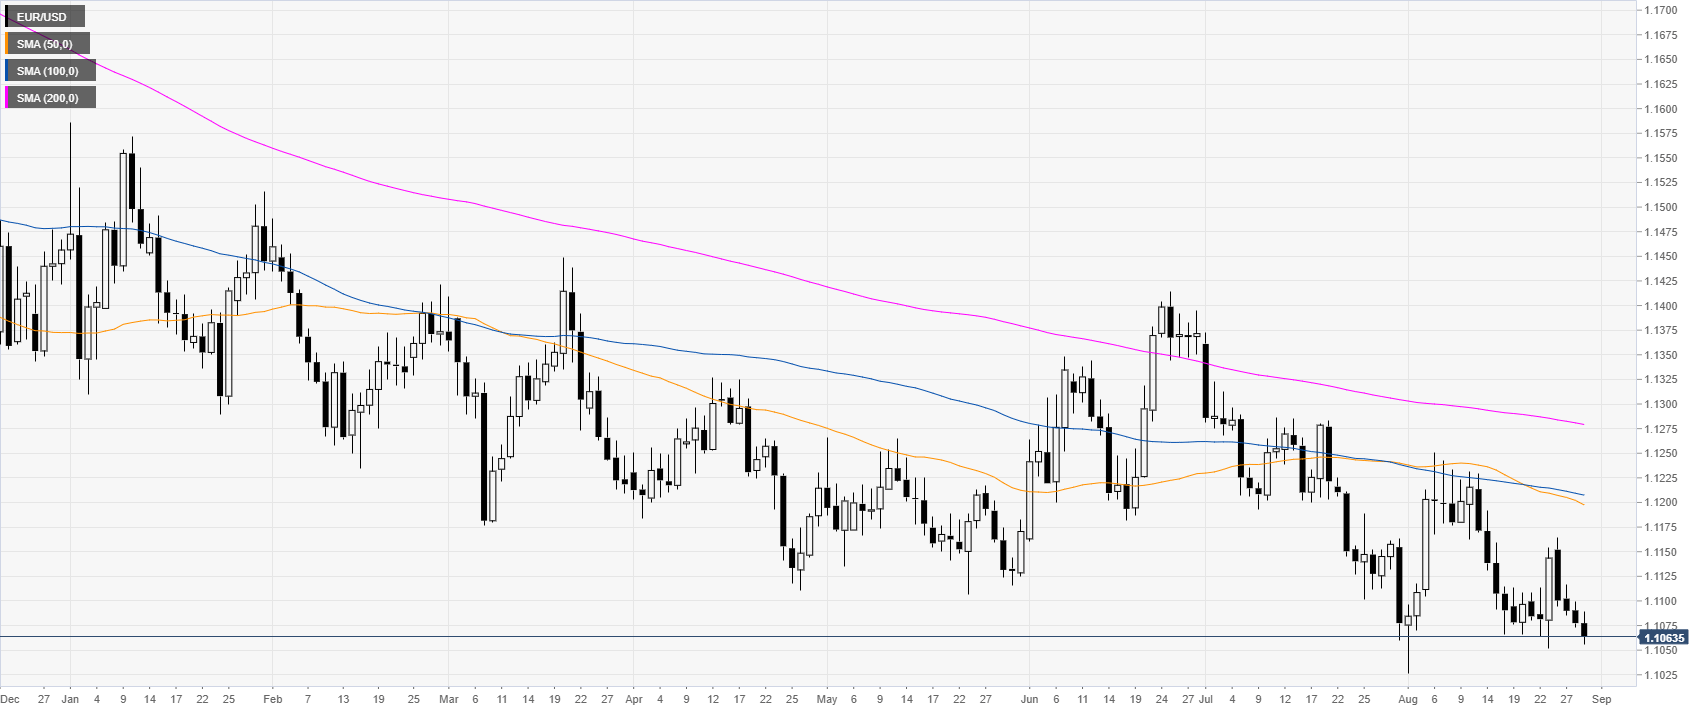
EUR/USD daily chart
On the daily time-frame, the shared currency is trading in a bear trend below its main daily simple moving averages (DSMAs). The US Gross Domestic Product Annualized (GDP) came in line with expectations at 2% in the second quarter. Earlier in the London session, the German inflation in August (YoY) came below expectations at 1% vs. 1.2% forecast by analysts.
EUR/USD 4-hour chart
The Fiber is under selling pressure below the main SMAs. The market is trading below the 1.1080 resistance, which is leaving the door open for a potential move down towards 1.1052, 1.1033 and 1.1016 levels, according to the Technical Confluences Indicator.
EUR/USD 30-minute chart
EUR/USD is near the weekly lows trading below the main SMAs, suggesting a bearish momentum in the near term. Immediate resistances are seen at 1.1080, 1.1098 and 1.1117 levels, according to the Technical Confluences Indicator. In the New York session, the market had a bullish spike which covered the entire daily range only to be retraced minutes after. ECB’s Knot said there was “no need to resume a Quantitative Easing program” and “the ECB’s September meeting exactions are overdone.”
Additional key levels