GBP/JPY Technical Analysis: 200-hour EMA, 38.2% Fibonacci limit immediate declines
- GBP/JPY takes rest on the key support confluence after recent declines.
- Buyers look for entry beyond 23.6% Fibonacci retracement, sellers can aim for 140 during further south-run.
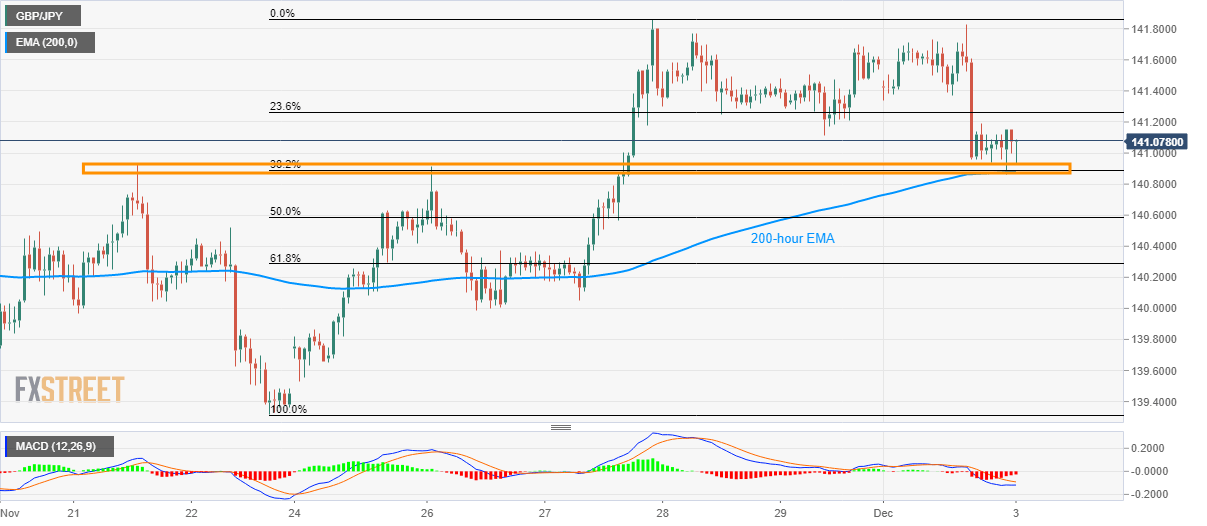
GBP/JPY sellers catch a breath around 141.00 amid Tuesday’s Asian session. The pair dropped the previous day but is taking rest on the support area including 200-hour Exponential Moving Average (EMA), 38.2% Fibonacci retracement of the last week’s run-up while also comprising highs marked on November 21 and 26.
Although 12-bar Moving Average Convergence and Divergence (MACD) flashes bearish signals, the strength of the support indicates the pair’s recovery. In doing so, 23.6% Fibonacci retracement level of 141.26 can act as immediate resistance ahead of the previous-month high near 141.90 and 142.00 round-figure.
During the quote’s further north-run beyond 142.00, lows marked during March and April month around 143.72/78 could lure the bulls.
On the contrary, pair’s declines below 140.86 support could trigger a slump to 140.00 mar. However, intermediate halts around 50% and 61.8% Fibonacci retracements, at 140.60 and 140.30 respectively, can’t be ruled out.
GBP/JPY hourly chart
Trend: Pullback expected