Back
7 Jan 2020
US Dollar Index Price Analysis: DXY runs up to the 97.00 handle
- DXY is rolling into Asia near the 97.00 level.
- The level to beat for bulls is the 97.20 resistance.
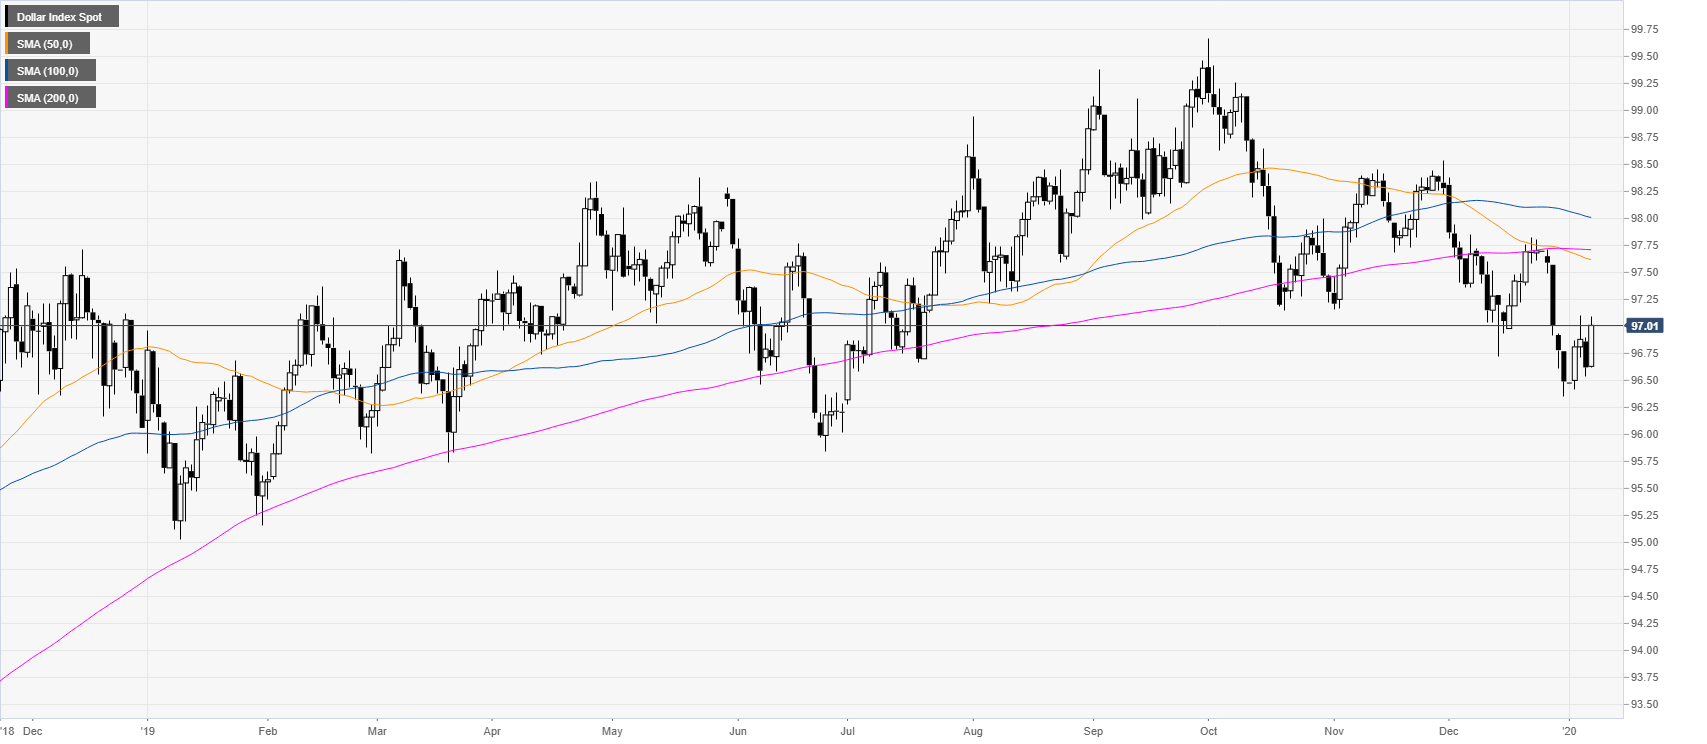
DXY daily chart
The greenback is trying to bottom out while trading below its main daily simple moving average (SMAs).
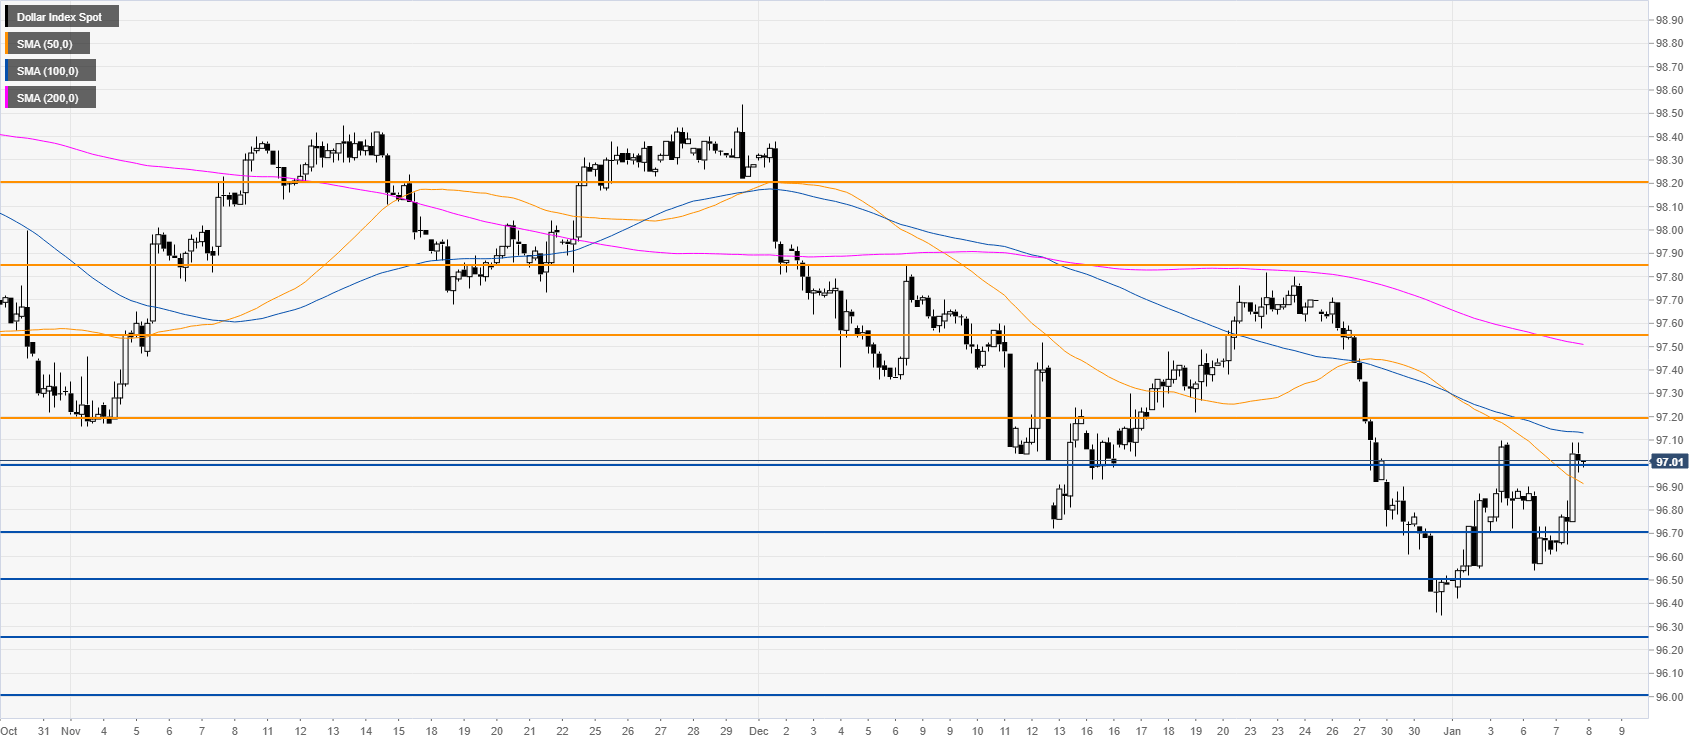
DXY four-hour chart
DXY is accelerating to the upside, running into the 97.00 handle and near the 50/100 SMAs. A clear break beyond the 97.20 level would likely attract further buying interest. Further up resistance is seen at the 97.55 and 97.85 resistances. Support is seen near 97.00 and 96.70 levels.
Additional key level