GBP/USD Technical Analysis: Turns vulnerable below a short-term ascending trend-line support
- GBP/USD turns lower for the third consecutive session on Thursday.
- The technical set-up now seems tilted in favour of bearish traders.
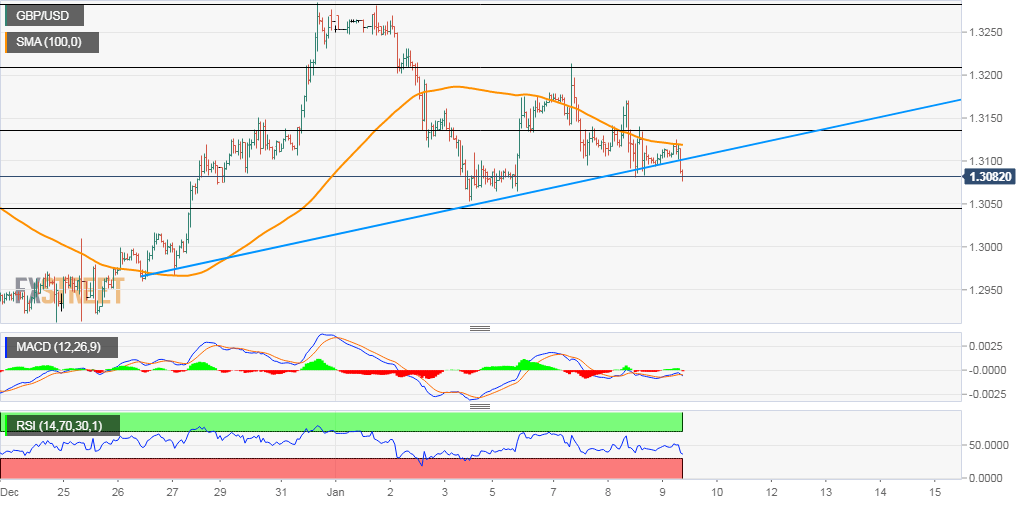
The GBP/USD pair failed to capitalize on the attempted intraday positive move and faltered near 100-hour SMA, turning lower for the third consecutive session.
This coupled with the fact that the pair has broken through a short-term ascending trend-line now seems to have shifted the near-term bias in favour of bearish traders.
Meanwhile, technical indicators on hourly charts have again started drifting into the negative territory and add credence to the near-term bearish outlook for the pair.
Hence, some follow-through weakness, possibly even below weekly lows towards challenging the 1.3055-50 support area, now looks a distinct possibility.
The mentioned support coincides with 23.6% Fibonacci level of the 1.3515-1.2905 recent pullback and should act as a key pivotal point for short-term traders.
However, oscillators on the daily chart – though have been lowing traction – are yet to gain the negative momentum and warrant some caution before placing aggressive bets.
GBP/USD 1-hourly chart