Back
20 Jan 2020
Gold New York Price Forecast: XAU/USD bulls facing the 1563 resistance in the New York session
- Gold is about to enter the New York session trading above the 1558/1555 support zone.
- The level to beat for bulls is the 1563 resistance.
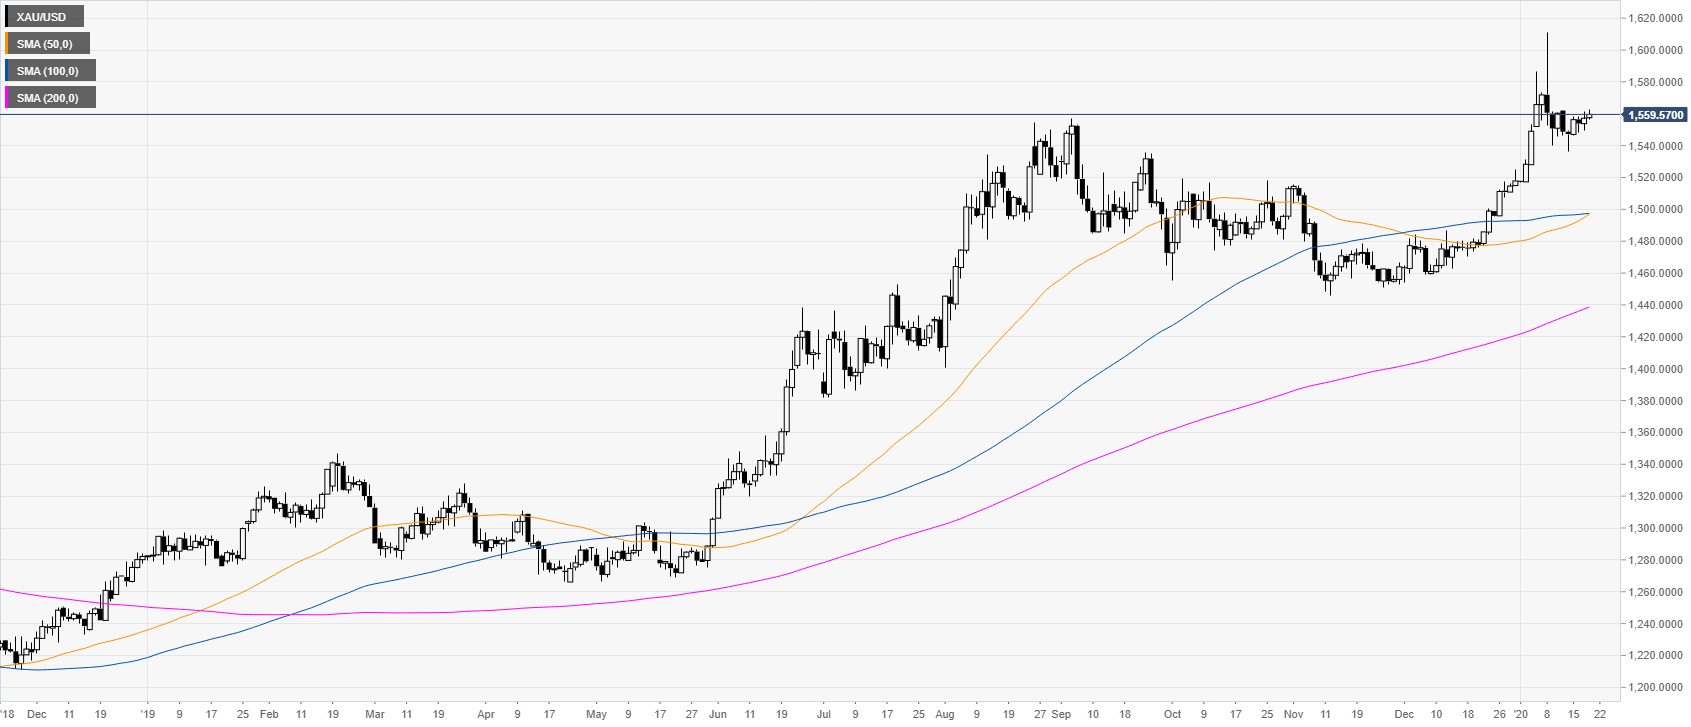
Gold daily chart
XAU/USD is trading in an uptrend above the main daily simple moving averages (SMAs). After a failure at the 1600 mark earlier in the month, the metal is regaining strength once again.
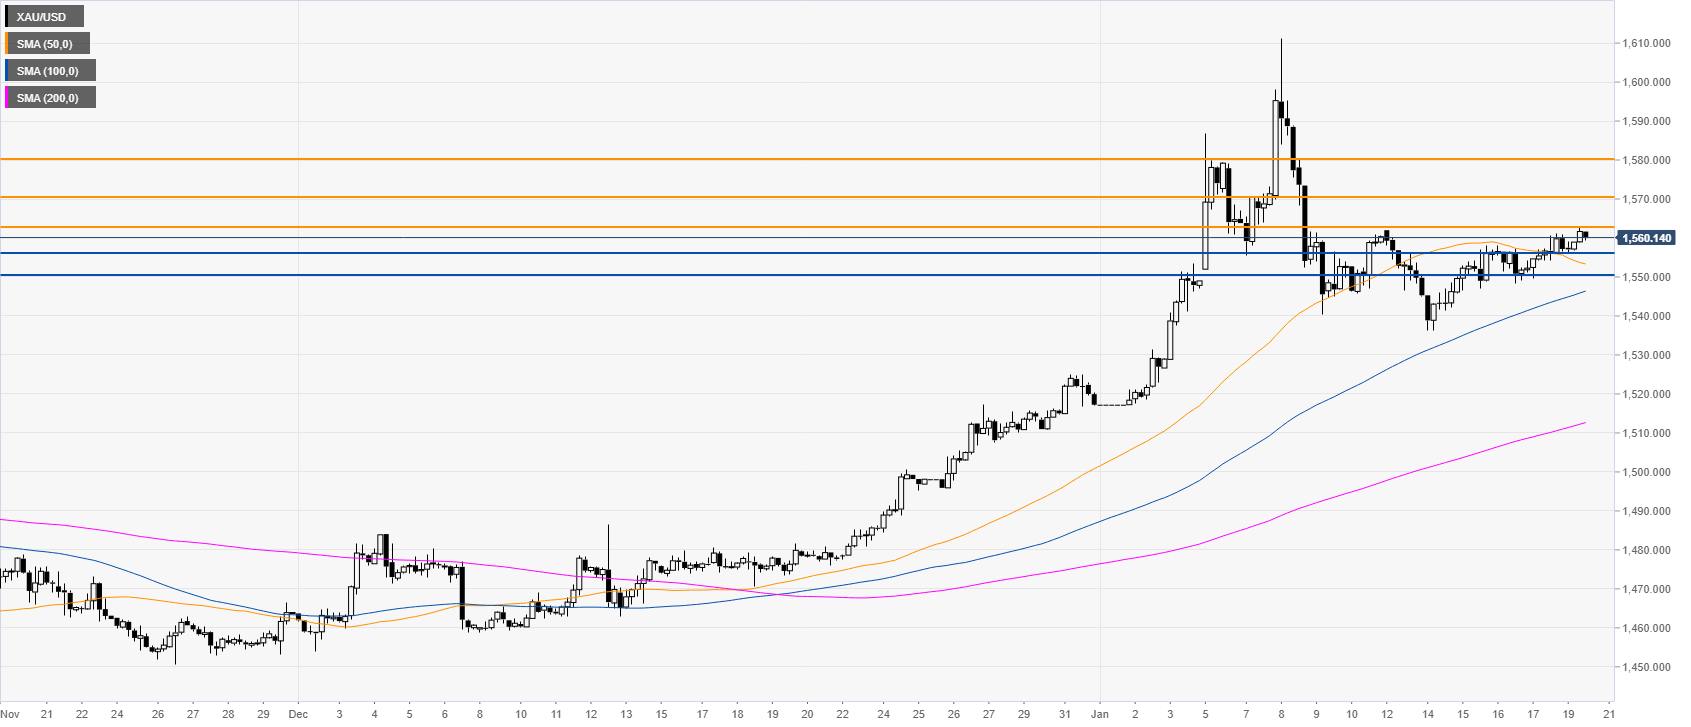
Gold four-hour chart
Gold is currently limited by the 1563 resistance as the metal is evolving in a bullish channel above the main SMAs. A break above the resistance can see the metal appreciating towards the 1570 and 1580 resistance levels.
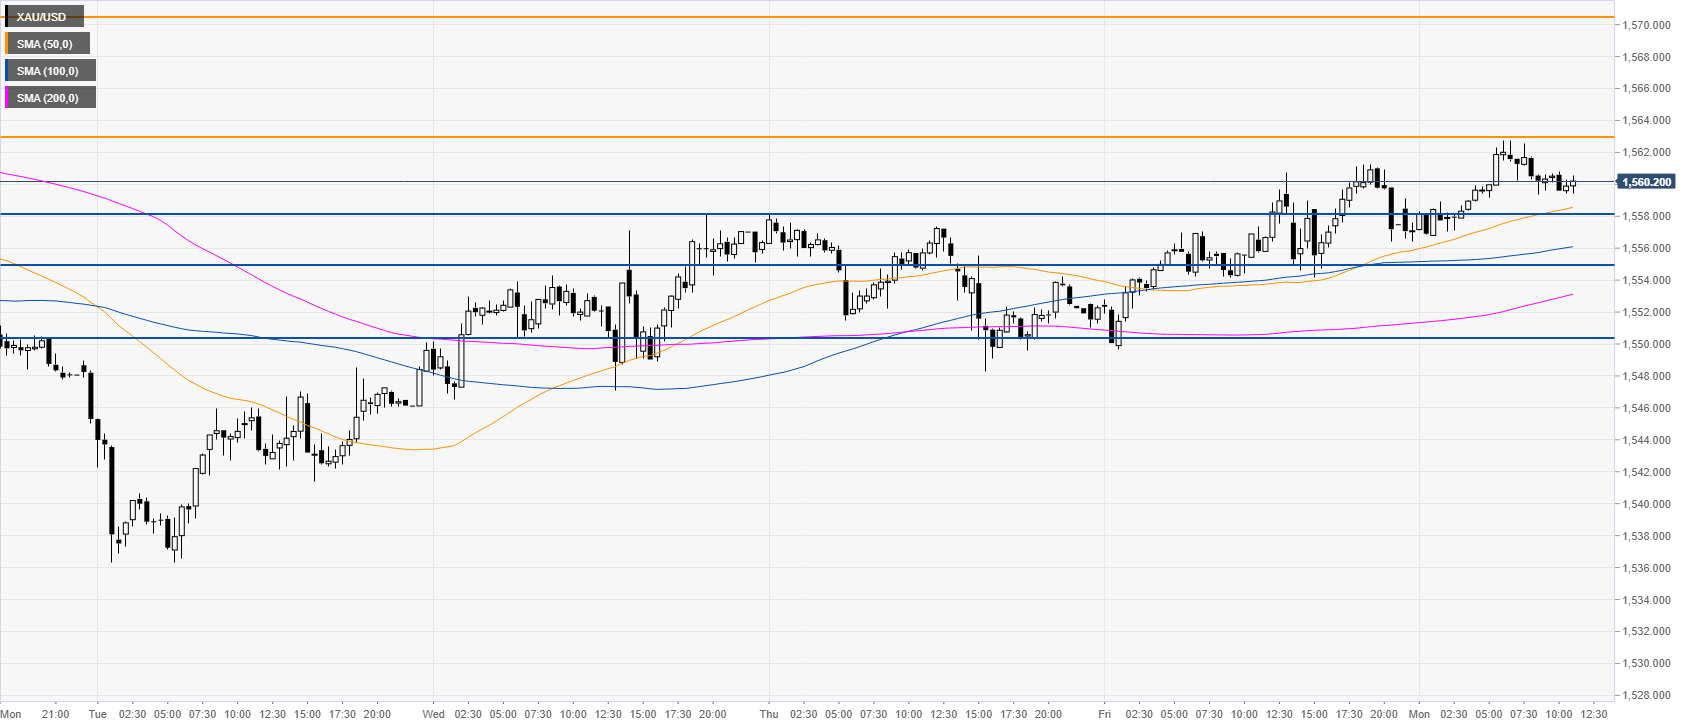
Gold 30-minute chart
The market is trading above the main SMAs suggesting a bullish momentum in the near term. The bullish bias would likely be invalidated below the 1558/1555 price zone as it could lead to a deeper retracement towards the 1550 level.
Additional key levels