Back
18 Feb 2020
S&P500 Price Analysis: Index gapped down from all-time highs, trades near 3370 level
- The S&P500 gapped down on Coronavirus fears.
- The level to beat for buyers is the 3400 resistance.
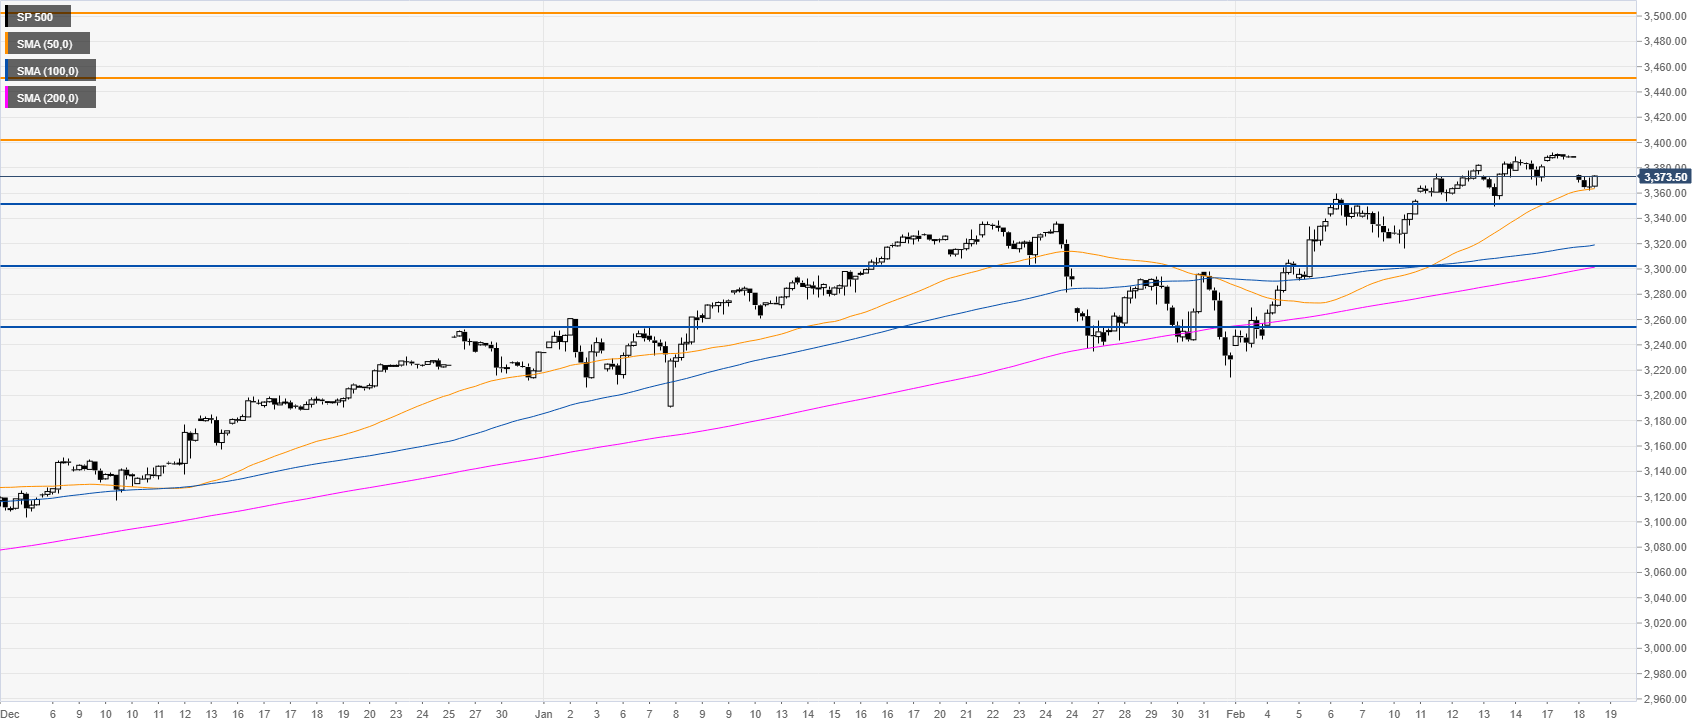
S&P500 daily chart
The S&P500 Index is trading in an uptrend above the main simple moving averages (SMAs) on the four-hour chart. After printing fresh all-time-highs, the market gapped down on Coronavirus fears and tested the 50 SMA. The trend remains for now intact and buyers will need to regain the 3400 figure to potentially extend the bull run towards the 3450 and 3500 levels. On the flip side, a break below the 3452 support can lead to a deeper retracement towards the 3300 and 3255 levels.
Additional key levels