Confirming you are not from the U.S. or the Philippines

โดยการให้คำชี้แจงนี้ ข้าพเจ้าขอประกาศและยืนยันอย่างชัดเจนว่า:
  • ข้าพเจ้ามิใช่พลเมืองหรือผู้ที่พำนักอาศัยสหรัฐอเมริกา
  • ฉันไม่ใช่ผู้พำนักอาศัยในฟิลิปปินส์
  • ข้าพเจ้าไม่ได้เป็นเจ้าของหุ้น/สิทธิ์ในการออกเสียง/ผลประโยชน์ของผู้พำนักในสหรัฐอเมริกาทั้งทางตรงและทางอ้อมเกินกว่า 10% และ/หรือไม่ได้ควบคุมพลเมืองหรือผู้พำนักในสหรัฐอเมริกาด้วยวิธีการอื่น
  • ข้าพเจ้าไม่ได้อยู่ภายใต้ความเป็นเจ้าของโดยตรงหรือโดยอ้อมมากกว่า 10% ของจำนวนหุ้น/สิทธิในการออกเสียง/ดอกเบี้ยและ/หรืออยู่ภายใต้การควบคุมของพลเมืองสหรัฐอเมริกาหรือผู้พำนักอาศัยโดยใช้วิธีการอื่น
  • ข้าพเจ้าไม่มีส่วนเกี่ยวข้องกับพลเมืองหรือผู้พำนักในสหรัฐอเมริกาตามมาตรา 1504(a) ของ FATCA
  • ข้าพเจ้าตระหนักดีถึงความรับผิดของข้าพเจ้าในการแสดงข้อความอันเป็นเท็จ
สำหรับวัตถุประสงค์ของคำชี้แจงนี้ ประเทศและดินแดนที่อยู่ภายใต้การปกครองของสหรัฐอเมริกาทั้งหมดจะเท่ากับอาณาเขตหลักของสหรัฐอเมริกา ข้าพเจ้าให้คำมั่นที่จะปกป้องและปกป้อง Octa Markets Incorporated กรรมการและเจ้าหน้าที่ของ Octa Markets Incorporated จากการเรียกร้องใด ๆ ที่เกิดขึ้นจากหรือเกี่ยวข้องกับการละเมิดคำชี้แจงของข้าพเจ้าในที่นี้
เราทุ่มเทให้กับความเป็นส่วนตัวและความปลอดภัยของข้อมูลส่วนบุคคลของคุณ เรารวบรวมอีเมลเพื่อมอบข้อเสนอพิเศษและข้อมูลสำคัญเกี่ยวกับผลิตภัณฑ์และบริการของเราเท่านั้น โดยการมอบที่อยู่อีเมลของคุณ คุณตกลงที่จะรับจดหมายดังกล่าวจากเรา หากคุณต้องการบอกเลิกการรับจดหมายหรือมีคำถามหรือข้อสงสัยใด ๆ กรุณาส่งไปที่ฝ่ายบริการลูกค้าของเรา
Octa trading broker
เปิดบัญชีการเทรด
Back

GBP/USD Price Analysis: Buyers and sellers jostle below 1.2300

  • GBP/USD looks for clear directions amid broad bearish trend.
  • Monday’s candlestick suggesting a trend reversal, oversold RSI question the sellers.
  • Buyers will wait for a sustained break of 200-day SMA for entry.

Having flashed a Doji candlestick formation on the daily (D1) chart, GBP/USD seesaws near 1.2270 during the Asian session on Tuesday.

The Cable searches for the clear catalyst as bearish MACD signals and trading below 200-day SMA keeps the sellers in command whereas a candlestick formation indicating trend reversal and oversold RSI pushes the buyers to look for entry.

Monday’s top near 1.2425 and 61.8% Fibonacci retracement of the pair’s September-December 2019 upside, around 1.2555, can offer nearby resistances to the quote ahead of 200-day SMA level of 1.2700.

In a case where the bulls manage to conquer 1.2700, November 2019 bottom surrounding 1.2820 will be on their radars.

Meanwhile, October 219 low near 1.2195 holds the key to the pair’s further downside, which if broken could drag the quote towards 1.2100 and then to September 2019 low surrounding 1.1960.

GBP/USD daily chart
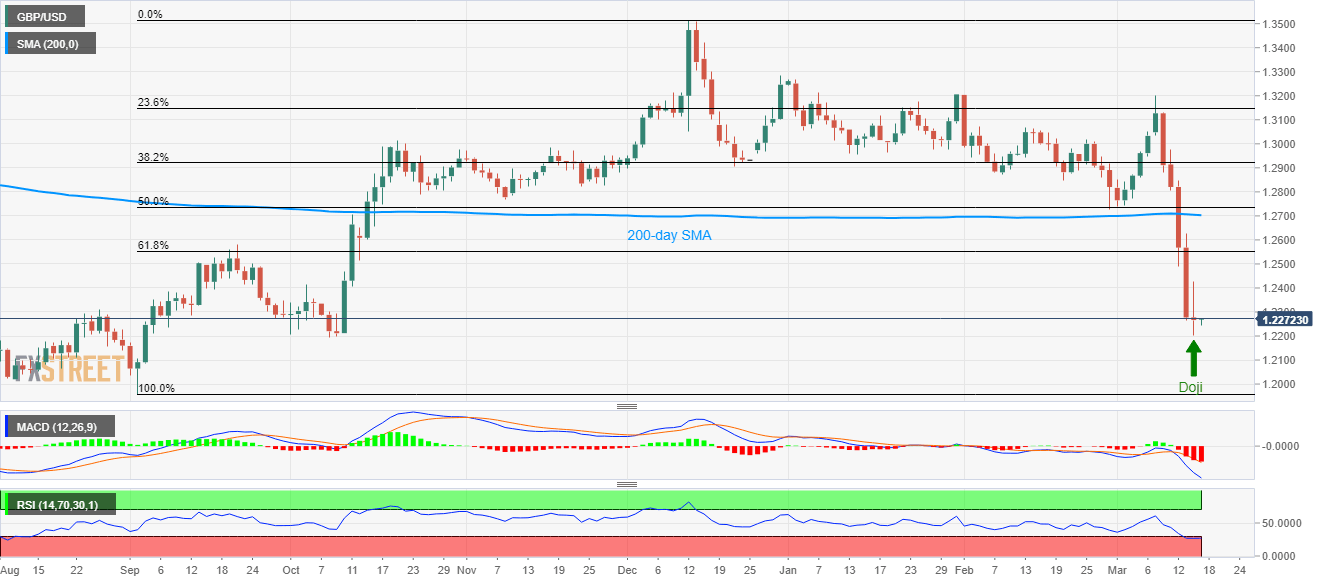
Trend: Pullback expected


AUD/NZD corrects from lowest levels since 2015

AUD/NZD is trading at 1.1007 between a range of 1.008 and 1.0123 following a bullish correction at 1.0021 which met the 2011 lows. COVID-19 is having
อ่านเพิ่มเติม Previous

Death toll from coronavirus outbreak in China's Hubei at 3,111 as of end-March 16

Mainland China's total number of confirmed coronavirus cases hits 80,881 as of end-March 16. Key notes Total number of coronavirus deaths reaches 3,22
อ่านเพิ่มเติม Next