USD/ZAR Price Analysis: Seesaws between 21 and 100-day EMA
- USD/ZAR recovers from intraday low, still losing near 0.10% on a day.
- Multiple tops marked during late-May will challenge the bulls past-21-day EMA.
- The key Fibonacci retracement levels, 200-day EMA stand tall to question the bears past-100-day EMA.
- RSI recovery from oversold area keeps the buyers hopeful.
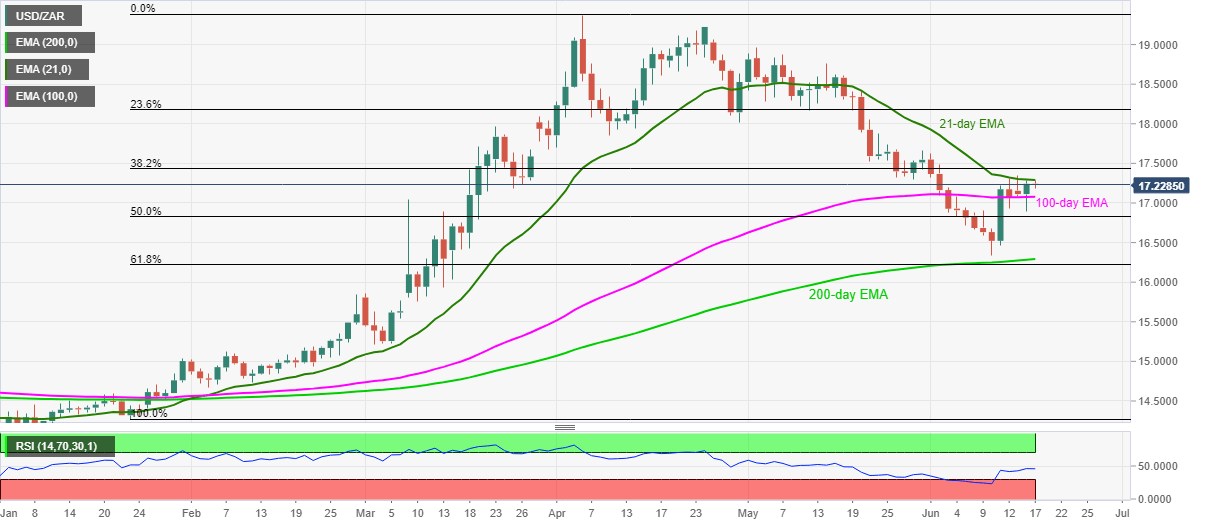
USD/ZAR bounces off 17.19 to 17.23, down 0.08% on a day, during the early Asian session on Wednesday. Even so, the pair stays between 21-day and 100-day EMA range that has been restricting its moves since Friday.
It should also be noted that the RSI’s gradual pullback from the oversold conditions favors the pair’s further recovery.
As a result, the buyers will look for entry beyond 21-day EMA level of 17.30, which in turn will aim for May 29 top near 17.67 ahead of targeting 17.73 level comprising the May 25 high.
During the pair’s further upside past-17.73, April 30 low around 18.00 could lure the bulls.
Alternatively, a downside break of 100-day EMA, currently around 17.08 can fetch the quote to 50% Fibonacci retracement level of January-April upside, at 16.83.
However, 200-day EMA and the monthly low, around 16.35/30, followed by 61.8% Fibonacci retracement level of 16.22, could challenge the sellers afterward.
USD/ZAR daily chart
Trend: Further recovery expected