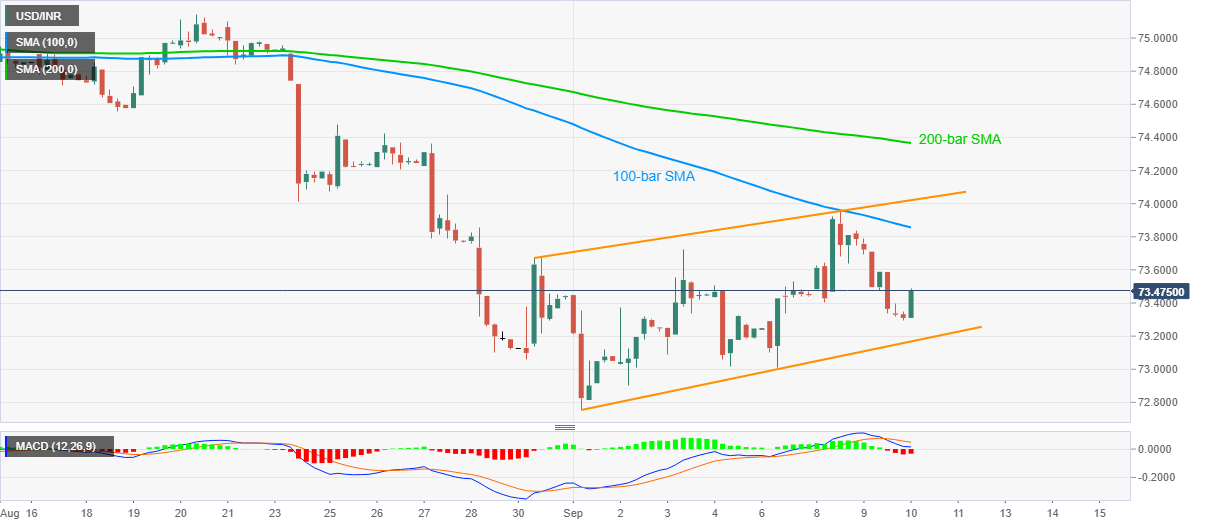
USD/INR Price News: Indian rupee buyers await confirmation of bearish flag
- USD/INR pick-up bids from 73.30, defies the previous day’s halt to two-day winning streak.
- A bearish chart formation joins downbeat signals from MACD to keep pair sellers hopeful.
- The key SMAs add to the upside barriers other than the flag’s resistance.
USD/INR prints 0.23% intraday gains, at 73.47 now, while traders from India brush their screens for Thursday’s move. Even so, a bearish flag formation on the four-hour (4H) chart joins MACD signals to favor the sellers that dominated for the first time in a week on Wednesday.
As a result, the pair traders closely await a downside break of 73.15 to confirm the pattern suggesting a heavy downside toward the yearly low of 70.46.
However, the monthly bottom surrounding 72.75 and September 2019 top of 72.37, followed by January month’s high of 72.22, can offer intermediate stops during the anticipated slump.
If at all the bulls keep the reins, 73.70 and 100-bar SMA level of 73.85 can question the immediate run-up before the upper line of the flag, at 74.00 now.
Even if the quote manages to cross 74.00, the bulls are likely to be challenged by a 200-bar SMA level of 74.36 before highlighting the 75.00 threshold for the buyers.
USD/INR four-hour chart

Trend: Bearish
