USD/CAD Price Analysis: Fades recovery moves above 1.2800
- USD/CAD struggles to keep bounces off 100-bar SMA.
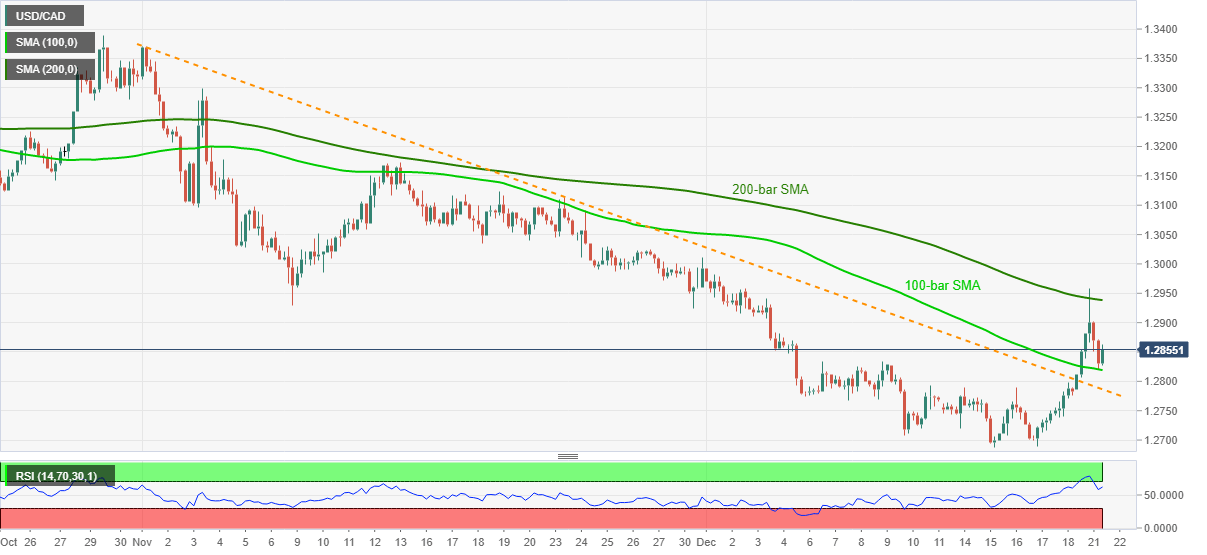
- Sustained break of seven-week-old falling trend line suggest another attempt to cross 200-bar SMA.
USD/CAD eases to 1.2844, down 0.07% intraday, during the initial Asian session on Tuesday. The quote jumped to the highest in three weeks before stepping back from 200-bar SMA. However, the pullback couldn’t break the 100-bar SMA, needless to mention the successful trading above the previous resistance line from early November.
As a result, USD/CAD buyers are again likely to attach the key SMA resistance, at 1.2938 now, while 1.2960 and the 1.3000 psychological magnet can add filters to the upside.
In a case where the USD/CAD bulls dominate past-1.3000 threshold, the mid-November peak surrounding 1.3170 and the previous month’s high around 1.3300 will be in focus.
Alternatively, a downside break of 100-bar SMA, currently around 1.2820, needs to break below the multi-day-old support line near 1.2785 before attacking the monthly bottom of 1.2688.
Overall, USD/CAD is up for a corrective recovery but a clear run-up past-200-bar SMA becomes necessary to please the bulls.
USD/CAD four-hour chart
Trend: Further recovery expected