USD/JPY is tracking US 10-year yields into support structure
- USD/JPY bears taking control on a soft Us dollar but run into a wall of support.
- The daily and hourly charts are offering corrective prospects for the day ahead.
At the time of writing, USD/JPY is attempting to stabilise from the loss of the session (110.26) at 110.30 although is pressured by US yields swooping lower in Tokyo.
The 10-year yield is down 0.77% on the day and has dropped in recent trade from the recovery highs of 1.2950% to currently trade at 1.2850%.
Markets are jittery into the Federal Open Market Committee meeting this week that kick's off today and concludes with the Fed's chair, Jerome Powell's press conference on Wednesday following the statement.
There is a great deal of uncertainty leading into the meeting considering the recent spike of coronavirus cases vs the risk of higher inflation for longer and continued signs of economic recovery on US soil.
Markets were pricing for the central bank divergence, but there has been a sudden quadrupling of daily infections to levels approaching those seen in last summer's virus surge.
The bond market is often a reliable indicator of the market's sentiment.
Given the drop in US nominal and real rates at the start of the week, investors are potentially looking through the prospects of stubbornly higher inflation which has dented the greenback at the start of this week.
Overnight, The US dollar underperformed all the majors. USD/JPY followed US Treasury yields down to 110.12 then recovered to and 110.40.
US 10yr bonds rallied on Monday, while the 2-year government bond yield dropped to 0.20%, and the 10-year government bond yields fell to 1.22% before settling at 1.28%.
Consequently, the US 10-year real yields fell to a record low of -1.13% before recovering to -1.10% as bond traders acknowledged 'the conflicting narratives that will make the Fed’s job even trickier as it meets this week.
The dollar index DXY, which measures the currency against six major peers, slipped some 0.40% to 92.531 but was still close to last week's 3-1/2-month high of 93.194.
In Asia, the US dollar has also taken a trip to the downside along with the sip-up in yields to print close to the session lows of 92.558, weighing on USD/JPY.
USD/JPY technical analysis
However, the price is now confronting what would be expected to be significant support from both a daily and hourly perspective.
Daily chart
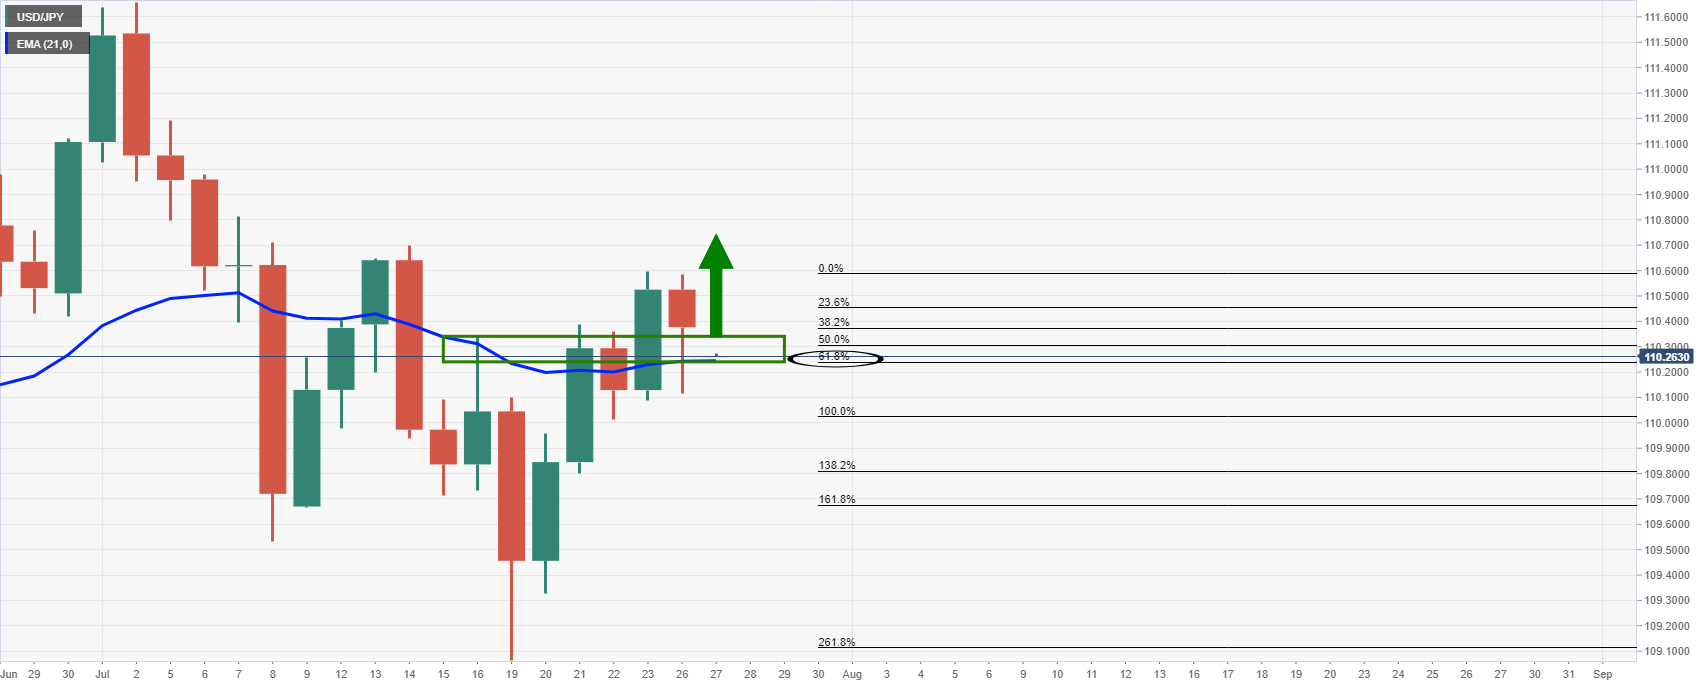
The price is now testing the prior daily highs and the confluence of both the 21-day EMA as well as the 61.8% Fibonacci retracement level. Such a combination is usually a solid area of support.
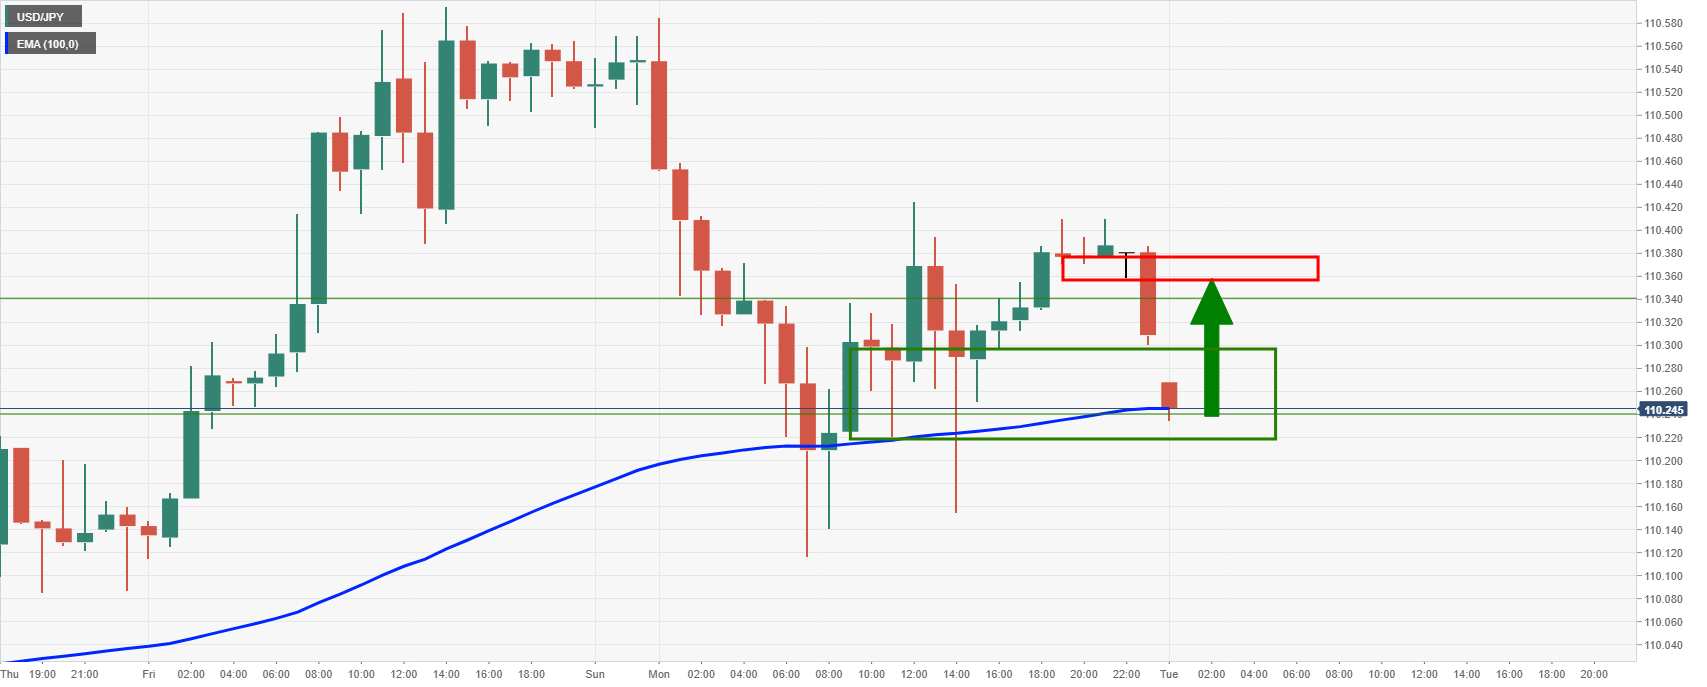
From an hourly perspective, as the chart below illustrates, the price is indeed meeting a confluence of the 100 EMA, old support and is leaving a bullish M-formation,(a high completion rate pattern).
The M-formation's neckline would be expected to be retested: