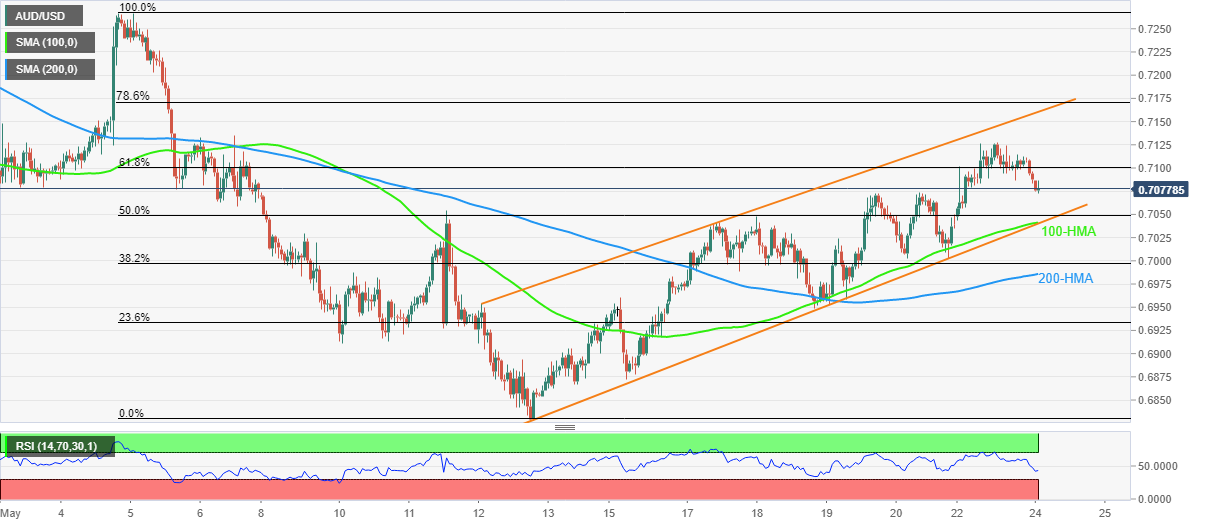
AUD/USD Price Analysis: Further downside eyes 0.7040 support confluence
- AUD/USD takes the offers to renew daily low, extends pullback from two-week top.
- 100-HMA, short-term bullish channel’s support lures bears amid downbeat RSI.
- 200-HMA adds to the downside filters, 61.8% Fibonacci retracement to test recovery moves.
AUD/USD remains on the back foot around the daily low near 0.7080 as it consolidates the previous week’s gains around a fortnight top. Even so, the Aussie pair remains inside a bullish chart formation during Tuesday’s Asian session.
The Aussie pair’s latest weakness could be linked to the inability to stay beyond the 61.8% Fibonacci retracement (Fibo.) of May 05-12 downside, as well as RSI pullback from the overbought territory.
As the RSI and the aforementioned channel both have some downside room before hitting the reversal point, AUD/USD is likely to extend the latest losses.
That said, the lower line of the stated channel and the 100-HMA, around 0.7040, appear a tough nut to crack for the pair sellers.
Also acting as a downside filter is the 0.7000 threshold and the 200-HMA level of 0.6985.
On the flip side, a clear break of the 61.8% Fibo. level, near 0.7100, will recall AUD/USD buyers.
Following that, the latest swing high and the channel’s upper, respectively around 0.7130 and 0.7160, can entertain the bulls before challenging them with the 78.6% Fibonacci retracement level near 0.7170.
AUD/USD: Hourly chart

Trend: Further weakness expected
