Gold Price Forecast: XAU/USD displays correction signs above $1,770, US NFP is in focus
- Gold price is oscillating in a wide range of $1,764.26-1,775.38 as the focus shifts to US NFP.
- Lower consensus for US NFP dragged the DXY to a fresh three-week low around 105.28.
- Fed’s rate hikes have trimmed employment generation in the US labor market.
Gold price (XAU/USD) has advanced towards $1,772.00 after a minor corrective move to near $1,766.67 in the late New York session. Broadly, the asset has turned sideways and is auctioning in a range of $1,764.26-1,775.38. Considering the ongoing upside momentum in the gold price and weakness in the US dollar index (DXY), bulls are expected to establish assets above $1,770.00 first. However, the odds of a decent correction are healthy.
The US dollar index (DXY) is facing the heat of lower consensus for the US Nonfarm Payrolls (NFP), which is due on Friday. The DXY has printed a fresh three-week low at 105.28 as the labor market is likely to display addition of 250k jobs in July, lower than the prior release of 372k.
A meaningful drop in the labor market is highly expected as higher interest rates by the Federal Reserve (Fed) have forced the corporate to levy more filters on investment avenues. Lower investment opportunities tend to keep employment generation in check.
Also, the commentary from big tech firms and automobile companies in their second-quarter earnings announcement indicated that the recruitment process will remain sluggish for the rest of 2022. Therefore, plenty of evidence is warranting lower job additions in July and more sluggishness ahead. This will keep the gold bulls underpinned against the greenback.
Gold technical analysis
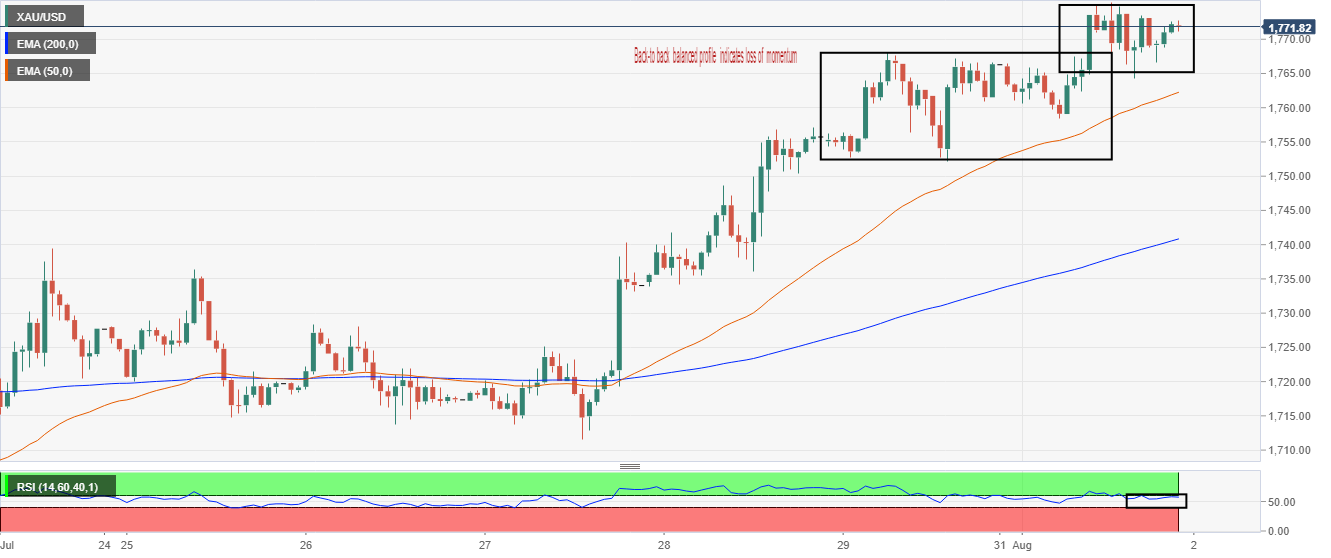
On an hourly scale, the gold price is displaying signs of exhaustion after a juggernaut rally. The precious metal has displayed a back-to-back balanced profile around the critical hurdle of $1,770.00. A consecutive balanced profile formation indicates exhaustion of bullish momentum and bolsters the odds of a correction ahead.
The 50-and 200-period Exponential Moving Averages (EMAs) at $1,762.30 and $1,741.00 respectively are still advancing, which favors an upside ahead.
Also, the Relative Strength Index (RSI) (14) has slipped to a 40.00-60.00 range, which indicates that the bulls are not strengthened anymore.
Gold hourly chart