USD/JPY Price Analysis: Triple top emerges in the one-hour chart, targets 143.30
- USD/JPY stumbles below the 144.00 figure due to US bond yields dropping.
- A triple top in the USD/JPY one-hour chart exerted downward pressure on the major, which cleared the 20 and 50-EMAs.
- The USD/JPY triple top targets a fall to 143.30.
The USD/JPY drops from weekly highs around 144.90 due to improved market sentiment and also falling US bond yields, with the US 10-year T-note plunging 23 bps, from around 4.01% to 3.73%. At the time of writing, the USD/JPY is trading at 143.99, below its opening price by 0.57%.
USD/JPY Price Analysis: Technical outlook
The USD/JPY daily chart depicts the pair as neutral-downward biased once Tuesday’s price action printed a doji. Worth noting that the Relative Strength Index (RSI) keeps pushing downwards while price action is below the September 27 daily low at 144.05, exacerbating a fall towards the 143.00 figure and beyond.
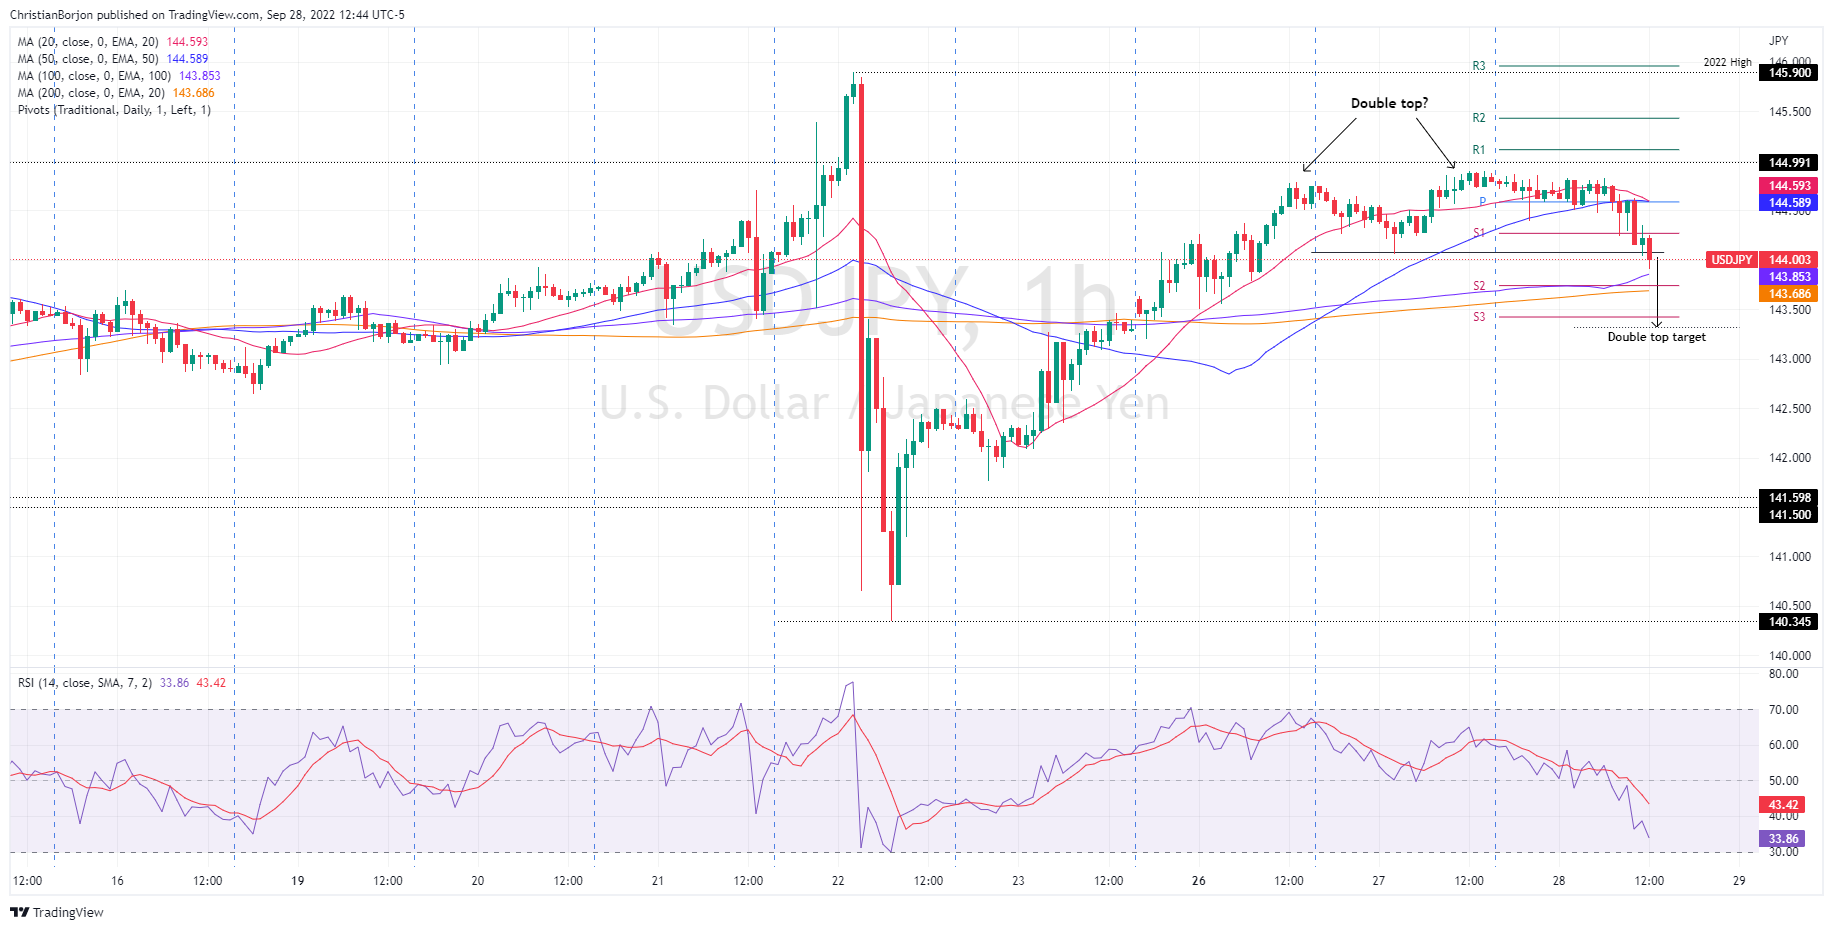
In yesterday’s article, “a double-top chart pattern is emerging at around the 144.60-75 area, which could pave the way for further losses. Nevertheless, the 20 and the 50-EMAs, meandering around 144.51 and 144.16, respectively, would be difficult to surpass.” It should be noted that the USD/JPY initially edged towards the weekly high, forming a “triple top” instead of a “double top,” and fell below the 20 and 50-day EMAs, accelerating the USD/JPY fall below the 144.00 mark.
Therefore, the USD/JPY first support would be 50-EMA at 143.85, immediately followed by the S2 daily pivot at 143.74, ahead of the 200-EMA at 143.68. A break below will expose the S3 pivot point at 143.42 and the triple top target at 143.30.
USD/JPY Key Technical Levels